
ALEXANDRIA, Va. — Federally insured credit unions ended the second quarter with nearly $2.5 trillion in assets and 146.1 million members as loan, deposit and net worth growth continued and industry profitability improved sharply, although overall loan delinquencies moved higher and smaller credit unions continued to underperform according to new data from NCUA.
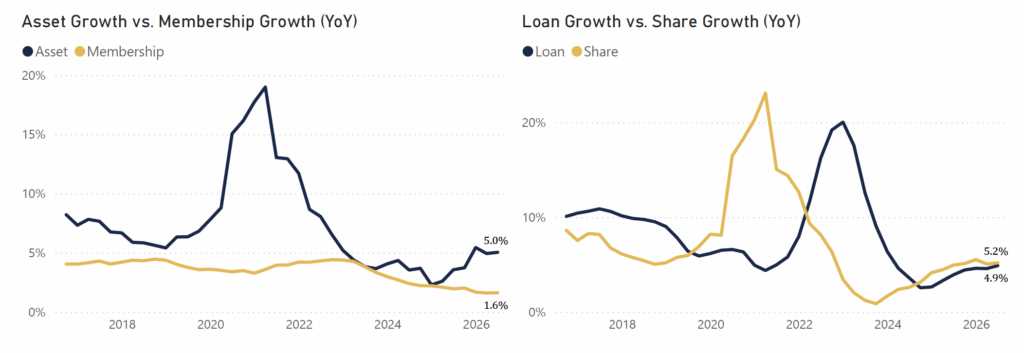
NCUA’s Quarterly Credit Union Data Summary for the second quarter, based on Call Report information self-reported by federally insured credit unions as of June 30, shows industry assets increased $120 billion, or 5%, during the previous 12 months to $2.499 trillion.
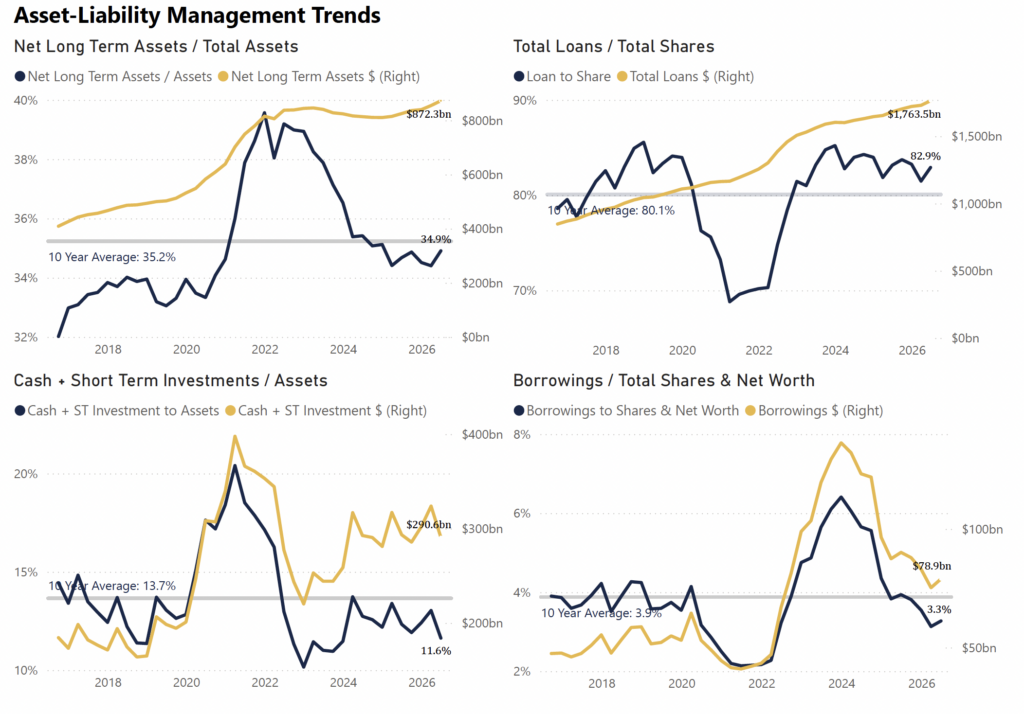
Loans increased $82 billion, or 4.9%, to $1.764 trillion, while total deposits grew $105 billion, or 5.2%, to $2.127 trillion.
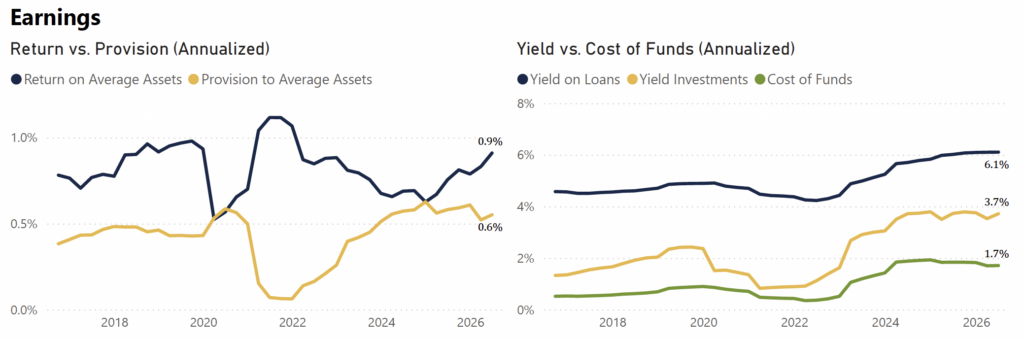
At the same time, annualized year-to-date net income jumped 26.9% from a year earlier to $22.4 billion, and the industry’s return on average assets improved to 0.91% from 0.76%.
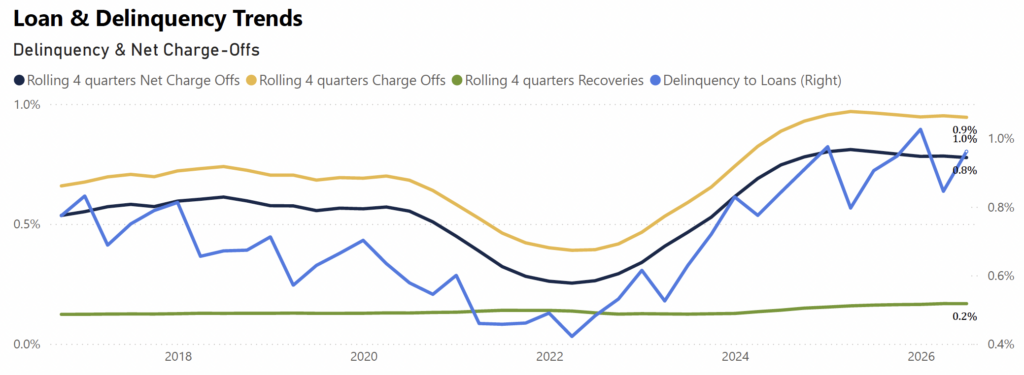
The data also show some continuing credit-quality pressure. The overall delinquency rate increased six basis points from a year earlier to 0.96%, with $17 billion in delinquent loans. Commercial loan delinquencies rose more sharply, while auto and credit card delinquency rates improved slightly.
Membership Continues to Grow as Number of CUs Falls
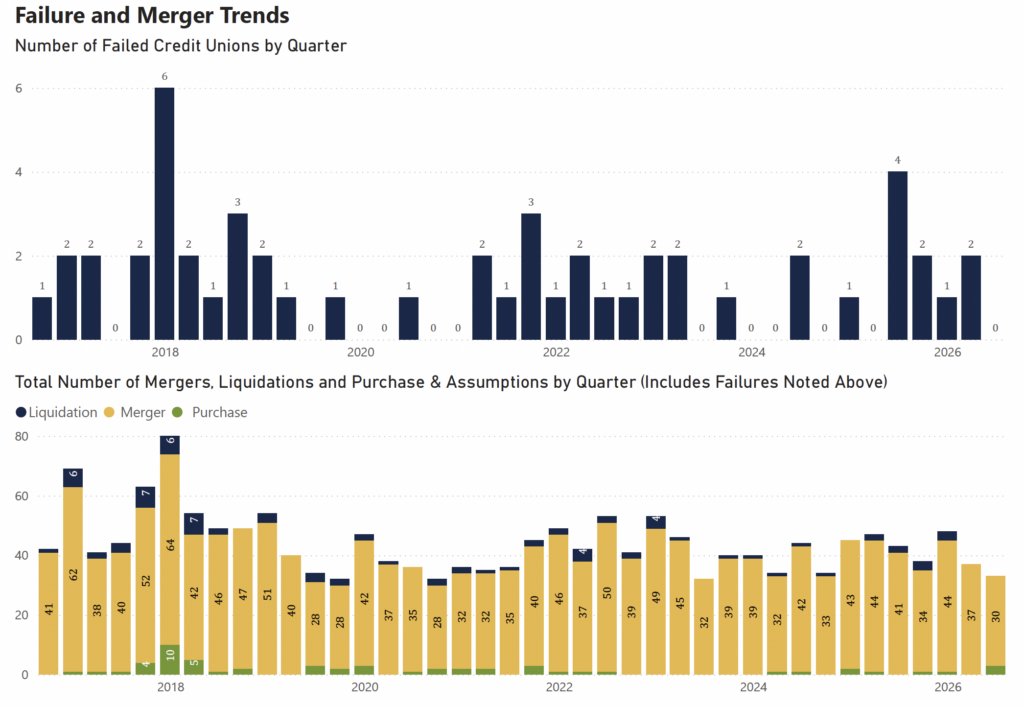
The industry continued a long-running pattern of consolidation even as membership increased.
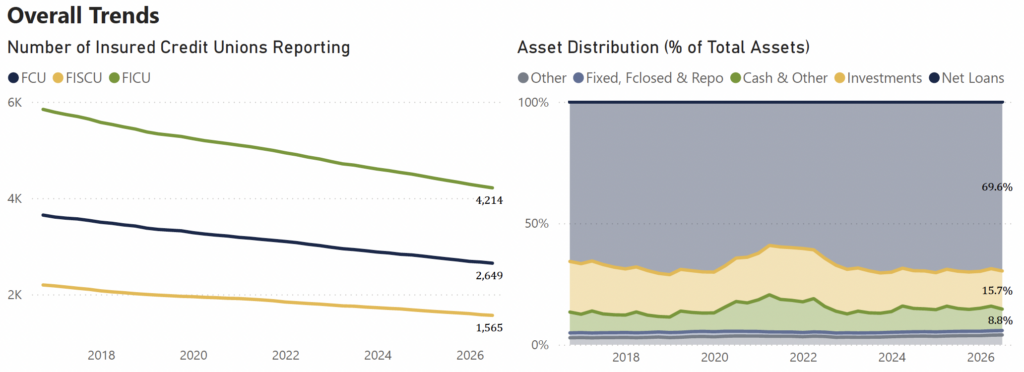
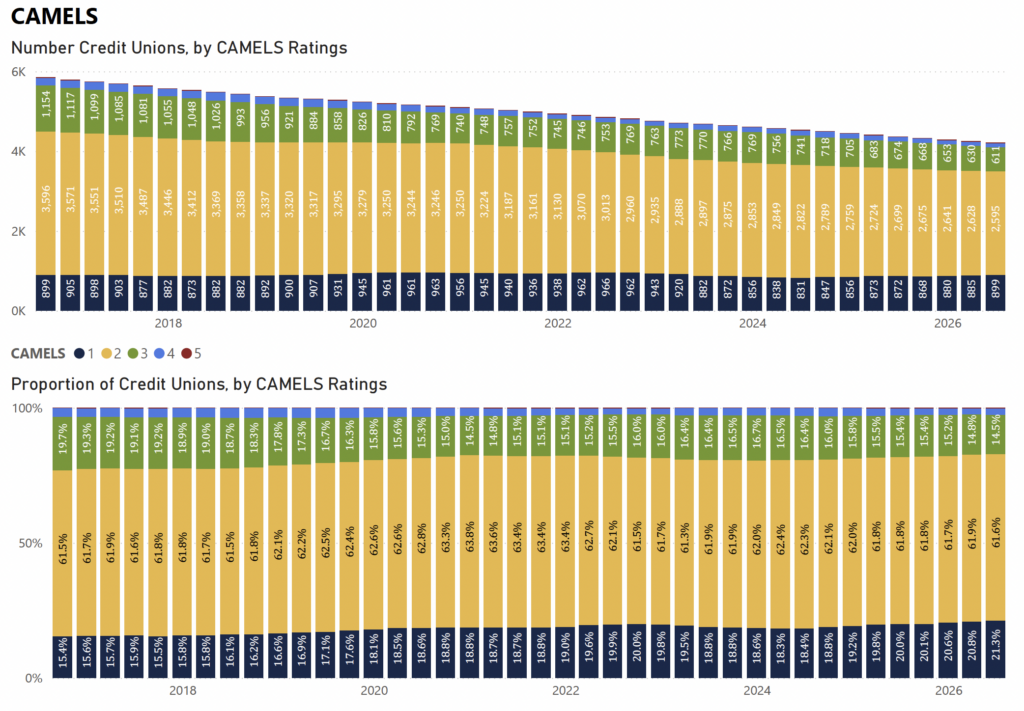
There were 4,214 federally insured credit unions at June 30, down 156, or 3.6%, from 4,370 a year earlier.
Of the total:
- 2,649 were federal credit unions, down 91, or 3.3%, from a year earlier.
- 1,565 were federally insured state-chartered credit unions, down 65, or 4%.
- 2,370 had low-income designations, down 27 from 2,397 a year earlier, although they represented 56% of all federally insured credit unions.
- 448 were designated minority depository institutions.
Membership increased by 2.3 million, or 1.6%, from 143.8 million a year earlier to 146.1 million.
The number of deposit accounts increased 2.4% to 296.4 million, while the number of outstanding loans declined slightly, by 0.3%, to 88.6 million.
The average outstanding loan balance increased $978, or 5.2%, to $19,906. The average deposit balance rose $494, or 3.5%, to $14,558.
Loan Growth Led by Commercial, Real Estate Lending
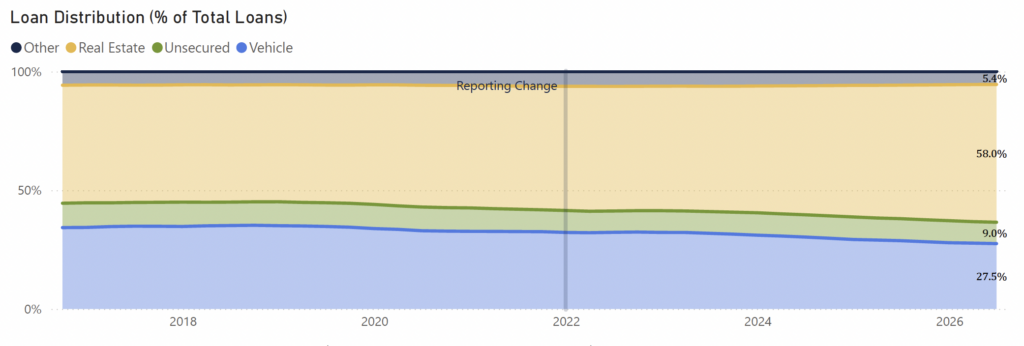
Total loans increased to $1.764 trillion from $1.681 trillion a year earlier.
The largest percentage gains were concentrated in commercial and real estate lending.
The data show:
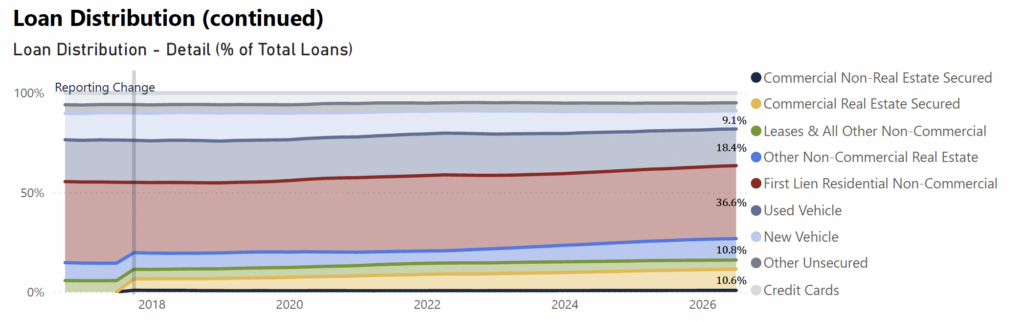
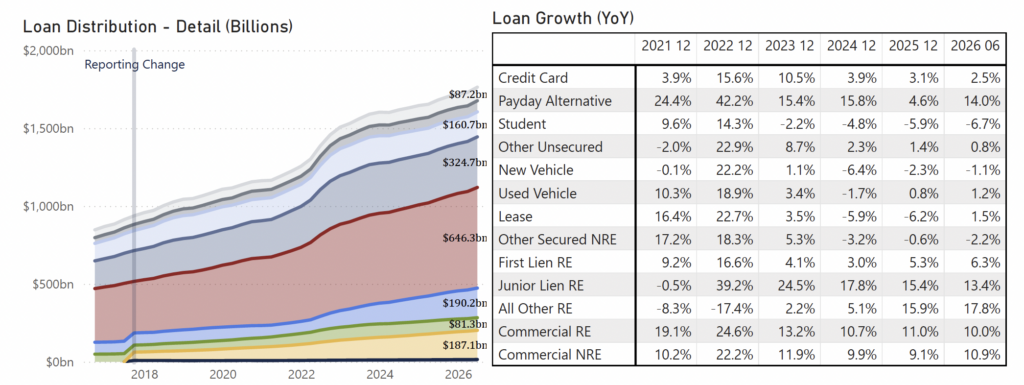
- Loans secured by one- to four-family residential properties increased 7.8% to $834.1 billion. First-lien residential loans rose 6.3% to $646.3 billion, while junior-lien loans increased 13.4% to $187.8 billion.
- Other real estate loans increased 17.8% to $2.4 billion.
- Commercial loans increased 10.1%, or $18.45 billion, to $201.7 billion. Commercial loans secured by real estate rose 10% to $187.1 billion, while those not secured by real estate increased 10.9% to $14.6 billion.
- The net member business loan balance used for regulatory reporting increased 10.3%, or about $18 billion, to $190.8 billion.
- Unfunded commitments for commercial loans increased 6.5% to $15.1 billion.
- Credit card balances rose 2.5% to $87.2 billion.
Auto Lending Nearly Flat
Auto lending remained comparatively weak.
Total auto loans increased just 0.4% from a year earlier to $485.4 billion.
Within that category, new-auto loans declined 1.1% to $160.7 billion, while used-auto balances increased 1.2% to $324.7 billion.
- Non-federally guaranteed student loans fell 6.7% to $6.23 billion.
- Other loans declined 0.6% to $146.4 billion.
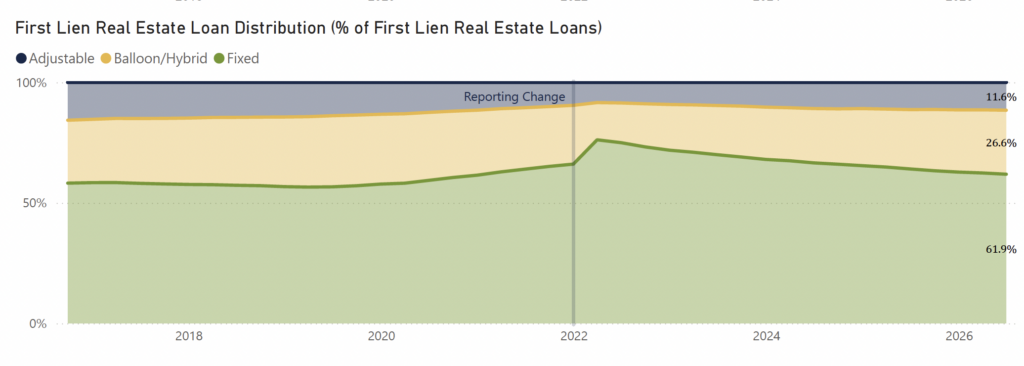
- Total real estate loans, including categories reported in the NCUA’s addenda, increased 8.2% to $1.024 trillion. Fixed-rate first mortgages, excluding commercial loans, increased 4.7% to $506.3 billion.
Delinquencies Increase to $17 Billion
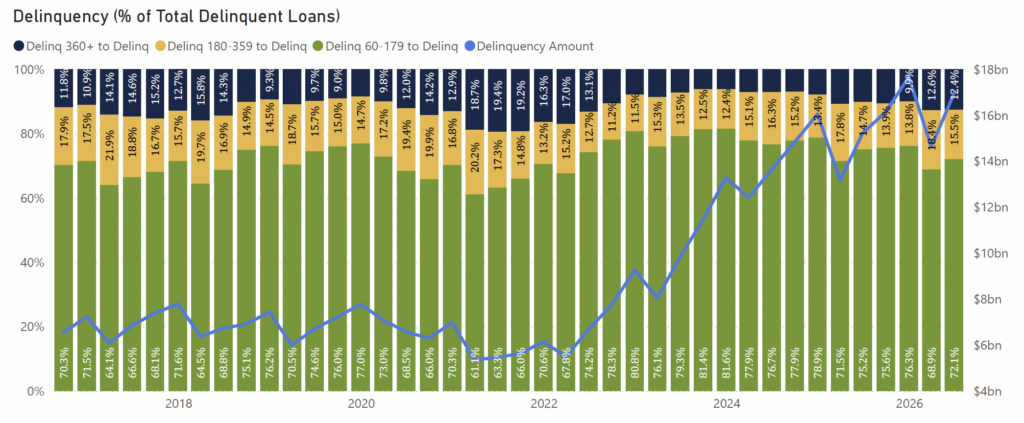
Total delinquent loans stood at $17 billion at the end of the second quarter, up $1.73 billion, or 11.4%, from a year earlier.
The overall delinquency rate increased to 0.96% from 0.91%.
Credit performance varied significantly by loan category:
- Noncommercial real estate delinquency increased to 0.83% from 0.74%.
- First-mortgage delinquency increased to 0.83% from 0.74%.
- Auto delinquency declined slightly to 0.81% from 0.82%.
- Credit card delinquency declined to 1.91% from 1.93%.
- Overall noncommercial loan delinquency increased to 0.93% from 0.89%.
- Commercial loan delinquency climbed to 1.23% from 1.05%.
Net charge-offs totaled $13.6 billion at an annual rate, up 3.4% from a year earlier.
However, net charge-offs as a share of average loans declined slightly to 0.78% from 0.79%.
Net Income Jumps Nearly 27%
Credit union earnings improved substantially during the first half of the year.
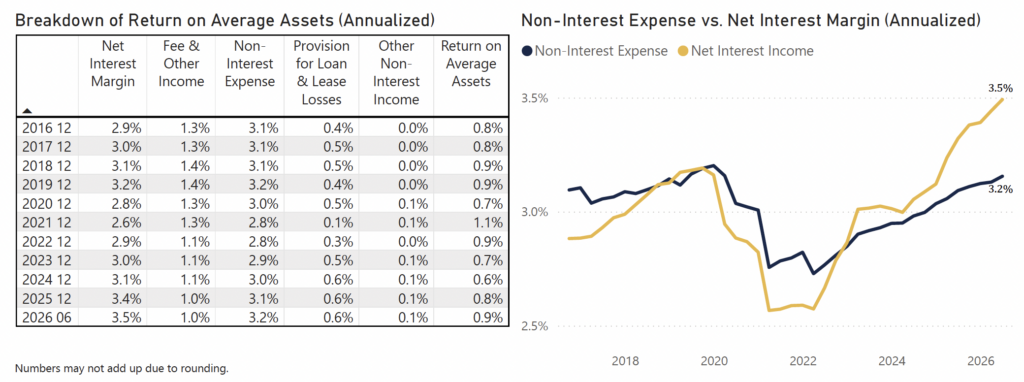
- Net income totaled $22.4 billion at an annual rate, up $4.75 billion, or 26.9%, from the comparable period in 2025.
- Return on average assets increased 15 basis points to 0.91%. The median ROA across federally insured credit unions was 0.71%, unchanged from a year earlier.
- Gross income increased 6.2% to an annualized $155.9 billion.
- Total interest income increased 6.1% to $128.2 billion, including $106.6 billion in gross interest income and $21.5 billion in investment income.
Noninterest income increased 6.7% to $27.8 billion. That included:
- $10.2 billion in fee income, up 5.8%.
- $15.2 billion in other income, up 4.9%.
- $2.3 billion in gains, losses and other noninterest income, up 26%.
Total expenses, including provision for loan and lease losses or credit loss expense, increased 3.4% to $133.5 billion.
Operating Expenses Continue to Rise
Noninterest expenses increased 7.4% from a year earlier to an annualized $77.8 billion.
- Employee compensation and benefits, the largest component, increased 7.9% to $41.1 billion.
- Office expenses increased 5.9% to $18.3 billion, loan-servicing expenses rose 7.4% to $5 billion and other noninterest expenses increased 7.8% to $13.3 billion.
- Interest expense moved in the opposite direction, declining 2.2% to $42.1 billion.
- Interest paid on borrowed money declined 15.8% to $4.1 billion, while share dividends fell 1.1% to $32.6 billion. Interest on deposits increased 3.3% to $5.4 billion.
- Provision for loan and lease losses or credit loss expense was $13.6 billion, essentially unchanged from a year earlier.
Net Interest Margin Improves
The industry’s net interest margin increased to an annualized $86.1 billion, up $8.29 billion, or 10.7%, from $77.8 billion a year earlier.
- As a share of average assets, net interest margin increased to 3.49% from 3.32%.
- The median credit union net interest margin was 3.75%, compared with 3.65% a year earlier.
- The median yield on loans increased to 6.23% from 6.09%, while the median average cost of funds edged down to 1.05% from 1.08%.
- Average industry assets increased 5.2% to $2.466 trillion.
Deposits Top $2.1 Trillion
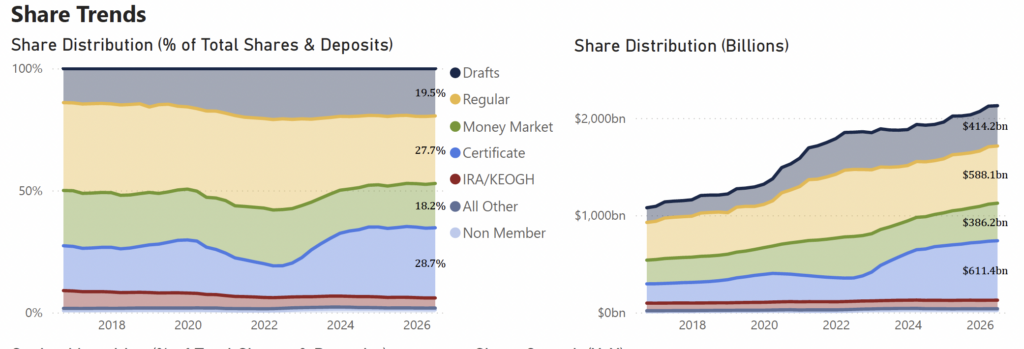
Total deposits reached $2.127 trillion, up $105 billion from $2.022 trillion a year earlier.
Insured shares and deposits increased $80 billion, or 4.3%, to $1.909 trillion.
Among deposit categories, share drafts increased 6% to $414.2 billion, while regular shares increased 2.6% to $588.1 billion.
- Other deposits increased 6.3% to $1.125 trillion.
- Money market accounts were among the faster-growing categories, rising 9% to $386.2 billion.
- Share certificate balances increased 5.9% to $611.4 billion.
- IRA and Keogh balances were essentially flat at $87.9 billion, while nonmember deposits declined 2.4% to $24.1 billion.
- All other shares increased 8.8% to $15.1 billion.
The industry’s loan-to-share ratio declined slightly to 82.91% from 83.15% a year earlier.
Net Worth Rises 8%
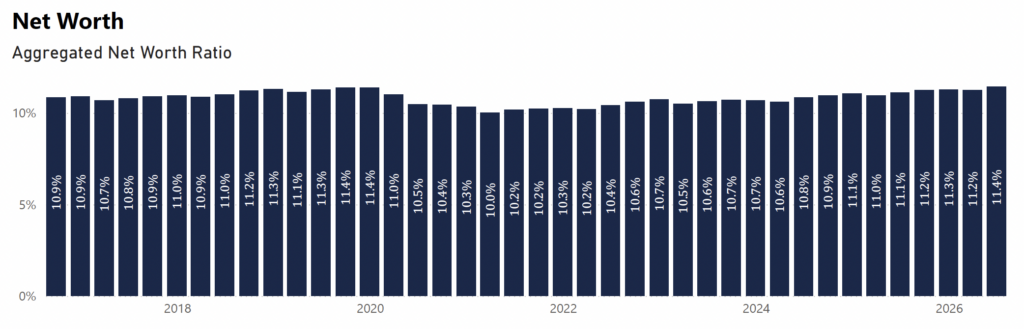
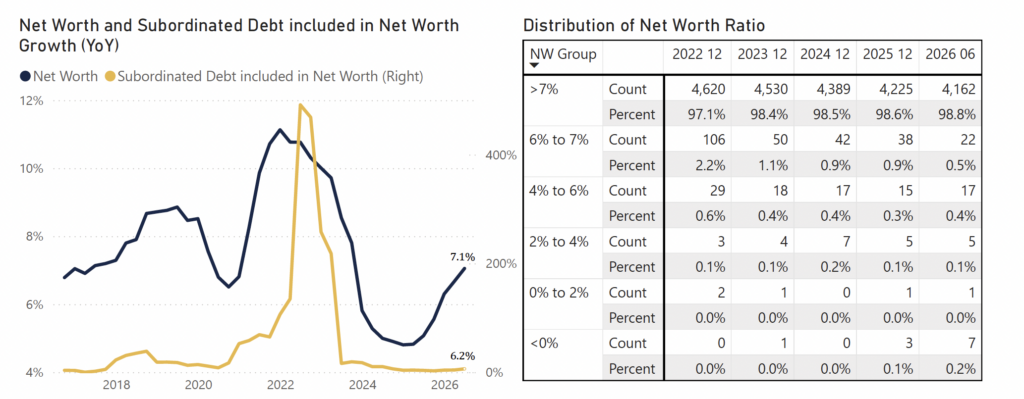
Credit union net worth increased $21.16 billion, or 8%, from a year earlier to $285.3 billion.
The systemwide net worth ratio increased to 11.42% from 11.11%.
NCUA noted that beginning with the first quarter of 2023, its reported net worth figures and ratio exclude the Current Expected Credit Loss transition provision.
Investments Increase
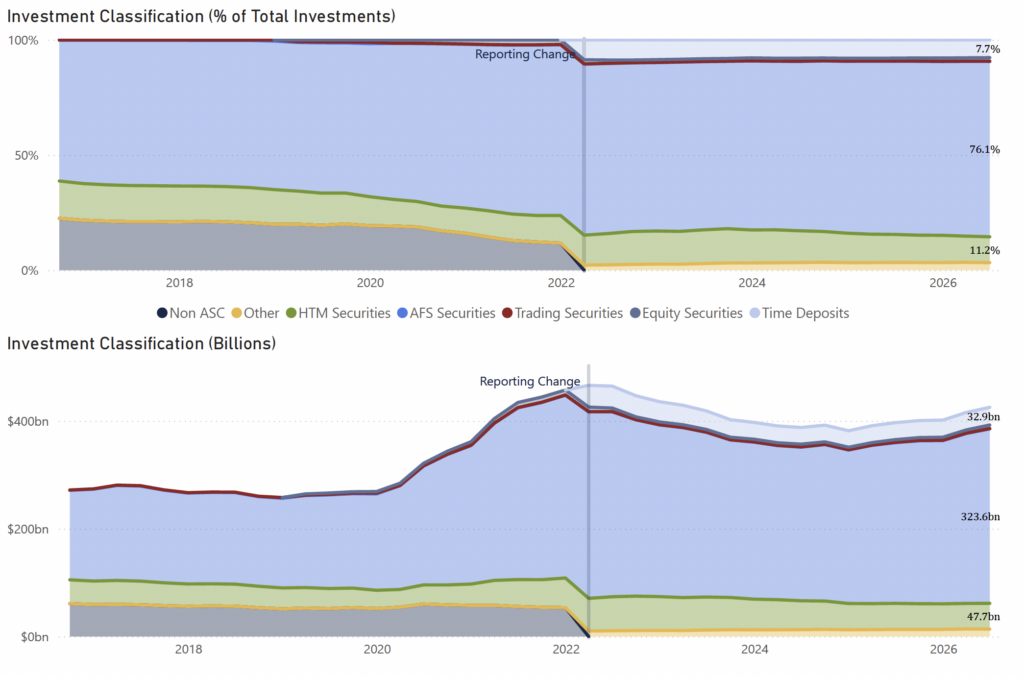
Total investments increased 7.2% from a year earlier to $425.3 billion.
- Investments with maturities of one year or less increased 1.9% to $103.4 billion, while investments with maturities between one and three years increased 3.3% to $109.1 billion.
- Longer-duration investments grew more rapidly.
- Investments with maturities of three to 10 years increased 14.2% to $196.7 billion. Within that category, three- to five-year investments jumped 19.1% to $102.9 billion, while five- to 10-year investments increased 9.2% to $93.8 billion.
- Investments with maturities exceeding 10 years declined 7.6% to $16.1 billion.
- Cash declined 2.5% from a year earlier to $187.2 billion, although cash on hand increased 4% to $23.4 billion.
- Other assets increased 12.8% to $122.6 billion.
Industry Continues to Shift Toward Larger CUs
The NCUA data also illustrate the continuing increase in the size of the typical credit union.
At the end of the second quarter:
- 25% of federally insured credit unions had less than $16.5 million in assets, compared with $15.7 million a year earlier.
- 50% had less than $67.7 million, up from $62.4 million.
- 75% had less than $280.7 million, compared with $255.1 million.
- 90% had less than $1.136 billion, up from $1.054 billion.
- The median asset size therefore increased 8.5% over the year.
Small CUs Continue to Shrink
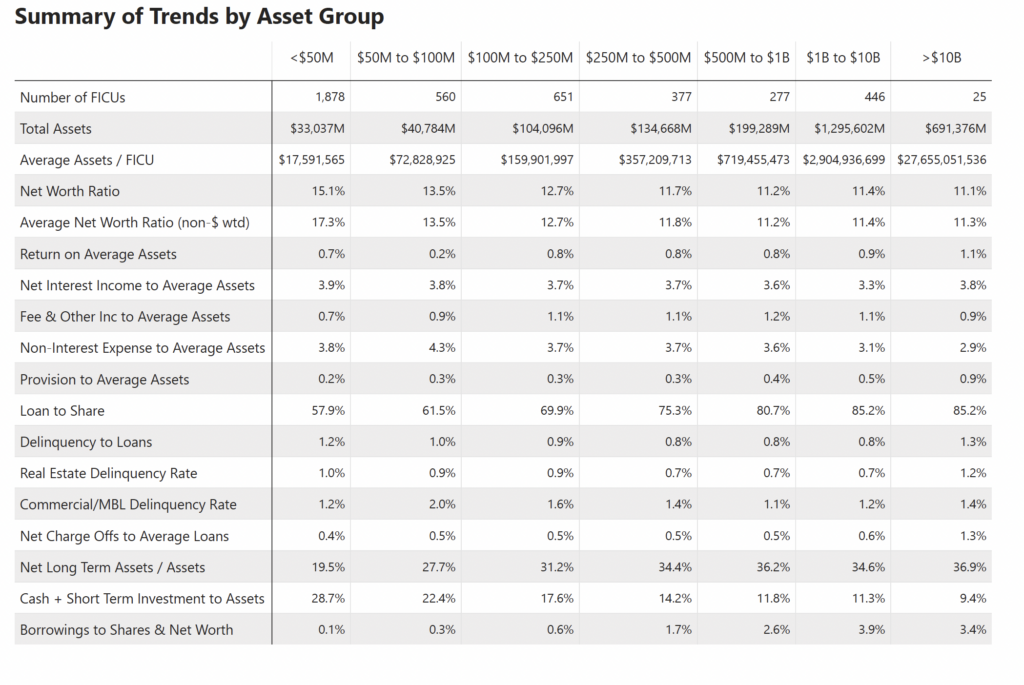
The NCUA separately reported data for 2,438 small credit unions, defined as those with less than $100 million in assets.
Those institutions had 6.3 million members, $73.8 billion in assets, $37.7 billion in loans and $62.9 billion in deposits.
Unlike the overall industry, small credit unions experienced declines across several major measures during the previous 12 months, according to NCUA, which said theirassets declined 4.3%, loans fell 7.4%, deposits declined 4.7%, membership dropped 7.3% and net worth fell 1.6%.
Small credit unions reported a 0.43% ROA, down from 0.75% a year earlier, although their 14.22% net worth ratio remained considerably above the industry average.
Small CUs’ loan-to-share ratio was 59.9%, delinquency rate was 1.07% and net charge-offs were 0.45% of average loans.
Federal Charters vs. State Charters

The 2,649 federal credit unions had 80.4 million members and $1.307 trillion in assets, while the 1,565 federally insured state-chartered credit unions had 65.7 million members and $1.192 trillion in assets.
- Federal credit unions reported $904 billion in loans and $1.111 trillion in deposits. State-chartered institutions had $859.4 billion in loans and $1.016 trillion in deposits.
- Federal credit unions posted a 0.95% ROA compared with 0.86% for state-chartered credit unions.
- Their net worth ratios were 11.52% and 11.31%, respectively.
- State-chartered credit unions had the higher loan-to-share ratio, 84.6% compared with 81.4%.
- Federal credit unions had a higher delinquency rate, 1.06% compared with 0.86%, and higher net charge-offs, 0.96% compared with 0.59% of average loans.
- Over the previous year, federal credit union assets increased 7%, loans rose 6.3%, deposits increased 7.3% and membership grew 3.5%.
- For state-chartered credit unions, assets increased 2.9%, loans rose 3.4% and deposits increased 3%, while membership declined 0.6%.
Complex CUs Hold Nearly $2.2 Trillion
NCUA reported 748 complex credit unions, defined for the report as those with more than $500 million in assets.
Those institutions accounted for 124.2 million members and $2.186 trillion in assets, or roughly 87% of all federally insured credit union assets.
The new report reveals:
- Complex credit unions held $1.575 trillion in loans and $1.858 trillion in deposits.
- They reported a 0.94% ROA, 11.25% net worth ratio, 84.8% loan-to-share ratio and median 3.47% net interest margin.
- Their delinquency rate was 0.97%, and net charge-offs equaled 0.82% of average loans.
- During the previous year, complex credit unions recorded 6% asset growth, 5.8% loan growth, 6.3% deposit growth, 2.8% membership growth and 9% net worth growth.
Low-Income CUs Show Strong Growth
The 2,370 credit unions with low-income designations had 82.5 million members and $1.374 trillion in assets, and reported $994.2 billion in loans and $1.167 trillion in deposits.
- Low-income-designated credit unions had a 0.87% ROA, 11.24% net worth ratio, 85.2% loan-to-share ratio and median net interest margin of 3.84%.
- Their delinquency rate was 0.93%, while net charge-offs equaled 0.68% of average loans.
- The group posted relatively strong year-over-year growth, with deposits up 7.4%, loans up 7%, assets up 7.4%, membership up 3% and net worth up 9.8%.
448 CUs Classified as MDIs
The NCUA reported 448 credit unions with minority depository institution designations.
- MDIs had seven million members, $102.6 billion in assets, $70 billion in loans and $87.8 billion in deposits.
- Their ROA was 0.61%, compared with 0.68% a year earlier, while their net worth ratio increased to 12.08% from 12.02%.
- MDIs had a 79.7% loan-to-share ratio, median net interest margin of 3.93%, delinquency rate of 1.03% and net charge-off ratio of 0.77%.
- Over the year, MDI assets increased 5.6%, loans rose 7.3%, deposits increased 5.3%, membership grew 2% and net worth increased 6.1%.
- NCUA cautioned that MDI counts may be affected by changes it made to its methodology and CU Online Profile questions beginning with the fourth quarter of 2024.
Capital Data Show Most Complex CUs Well Capitalized
The NCUA’s capital adequacy appendix shows the 748 complex credit unions had $2.19 trillion in assets and an average net worth ratio of 11.34% under the capital calculation used for that analysis.
- Of those institutions, 458 with $1.28 trillion in assets had opted into the Complex Credit Union Leverage Ratio framework.
- Their average CCULR was 12.19%, with reported ratios ranging from 8% to 30% and a median of 11%.
- For those institutions, average off-balance-sheet exposures represented 7.87% of assets, with a range from 0% to 25% and a median of 7%.
- Trading assets and liabilities averaged just 0.09% of assets, while goodwill and other intangible assets averaged 0.11%.
- Another 290 complex credit unions, with $908 billion in assets, reported under the risk-based capital framework.
- Their average risk-based capital ratio was 15.39%. Reported ratios ranged from 8% to 73%, with a median of 40%.
- The average net worth ratio among those institutions was 10.01%, with reported ratios ranging from 4% to 21% and a median of 12%.
- Of the 748 complex credit unions, the NCUA classified 736 as well capitalized, nine as adequately capitalized and three as below adequately capitalized.
For the full report, go here.