

NASHVILLE, Tenn.–Credit unions have been offered an update from J.D. Power on numerous auto lending-related issues, including the effects of tariffs, what manufacturers are doing, how loan terms and borrowers are changing, what’s ahead for new and used, and more.
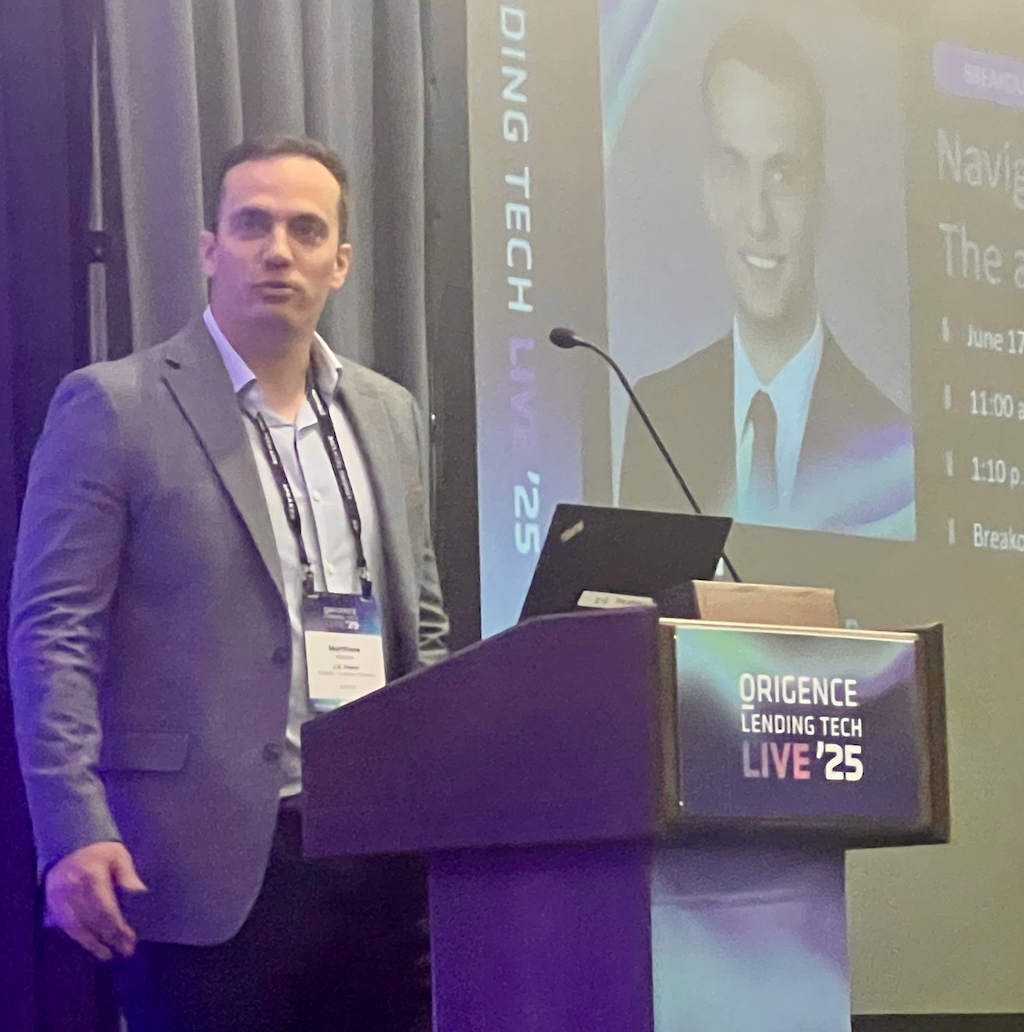
In remarks to Origence’s Lending Tech Live 2025 event, Matthew Molnar, client success director, data and analytics with J.D. Power, began by addressing the issue every credit union lender, auto buyer, auto dealer, manufacturer and others is concerned about: the effects from President Trump’s tariffs.
Using data from J.D. Power’s network of auto dealers, Molnar said there remains much uncertainty, in part due to the changing nature of the tariffs and in part because the tariffs affect different companies in different ways.
On average, however, the tariffs have increased prices approximately $4,800 per new vehicle, or about 10% of the average transaction price.
The Key Thing
“The key thing to keep in mind here, and I’m sure you’re aware of this, is obviously the tariff exposure is not equal across all brands,” he said, as the graphic here demonstrates.
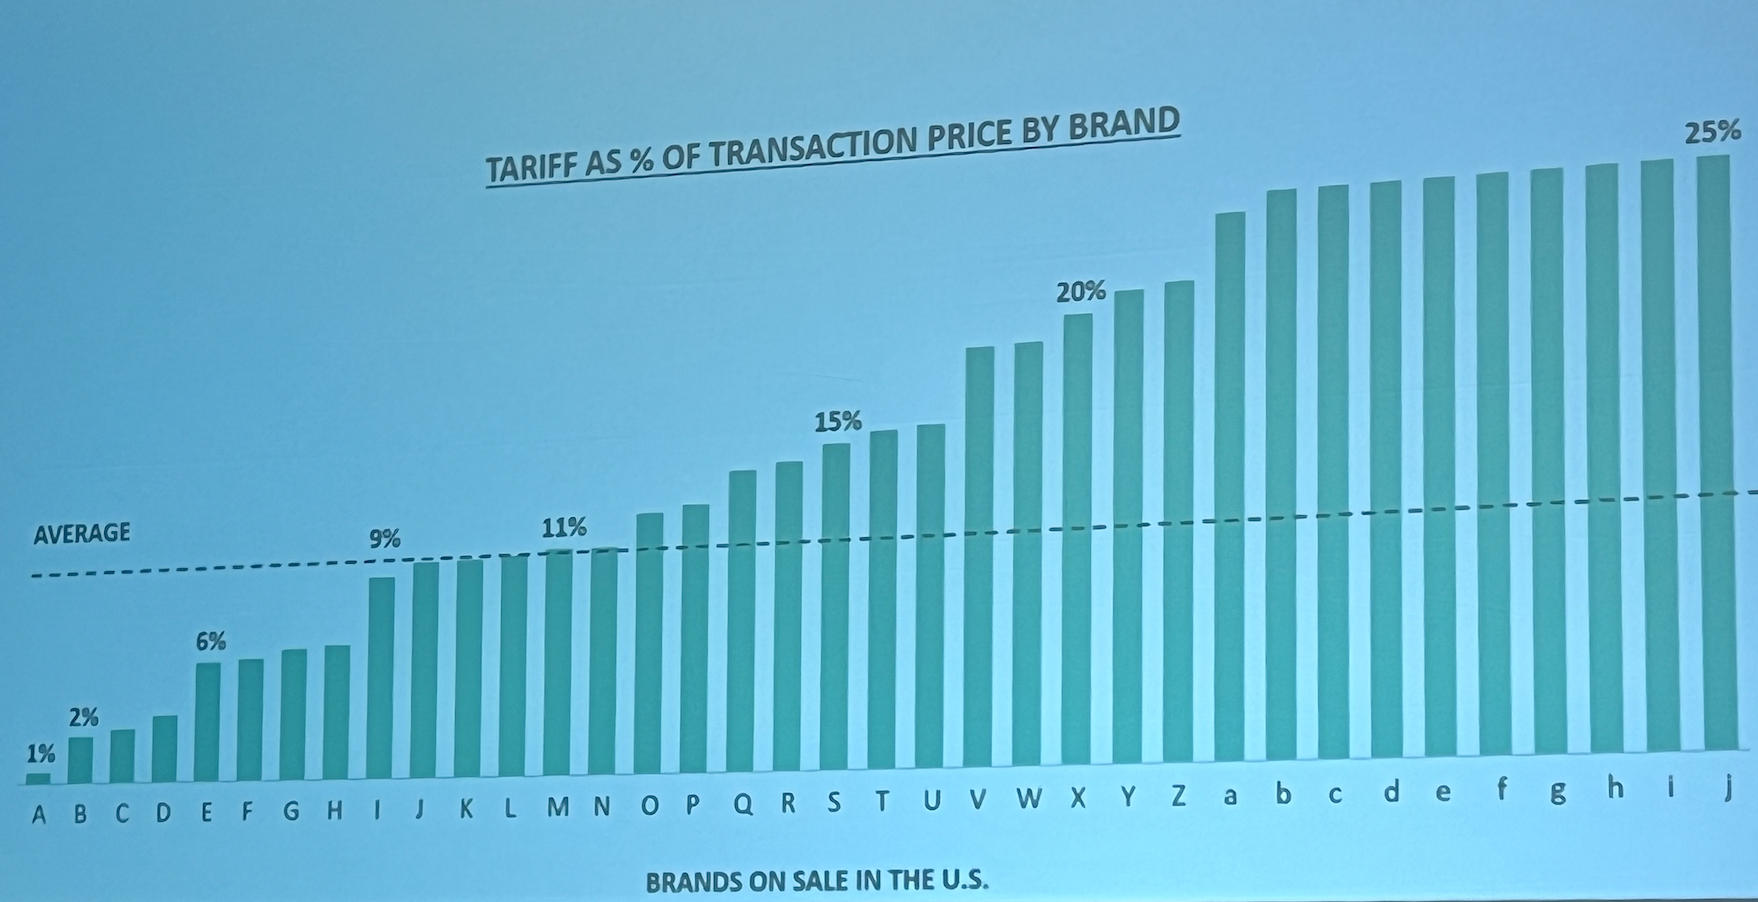
“What we saw at least in April and May is those OEMs try to pause importing vehicles,” he continued. “They are kind of waiting to see how things will shake out. They are dialing back their incentive spending,” especially on vehicles that are not tariff exposed, he explained. “The central thesis on consumer pricing impact is asymmetry makes it almost impossible for highly tariffed brands and models to increase prices without large volume declines. So, to maintain reasonable volumes, a large portion of tariffs must be absorbed by the OEMs.”
The longer-term expectation, said Molnar, is that more production will move back to the United States, and that will lead to price increases.
The Expectation Through Year-End
Looking through to year-end, Molnar said:
- “We expect new prices to increase by 5% by the end of the year. Some OEMs will have vehicles they won’t offer any longer.”
- Expect sales pace to slow by 7%. “This does not take into account any general economic effects,” he added.
New Market Response to Tariffs
How are consumers responding? According to Molnar, higher prices and the concerns over tariffs spiked demand in March through the first half of April, with 173,000 additional vehicles sold over trend, which is known as “pull-ahead” demand. Retail volume began to slow at the end of May, and during May there were 81,000 fewer units sold, which is known as “payback.”
Looking at the data for household income groups, the strongest pull-ahead sales could be seen among those with incomes of more than $250,000, while sales growth was moderate among those with incomes under $100,000, Molnar said.
Now, however, the higher-income buyer has pulled back, with J.D. Power theorizing they are taking a wait-and-see approach to auto purchases.
Shifting Credit Mix
Credit mix has also significantly shifted, the J.D. Power data show. Non-prime and subprime borroers have taken their largest share of the market since 2021, with 9% of sales in May going to subprime buyers, up from 6% at the same time a year ago.
Unlike the supply crash of 2021-22, OEMs are still shipping units, noted Molnar, pointing out there were more new vehicles shipped to dealers in May of 2025 than in May of 2024.
The data also show “hybrids” have just taken off in terms of sales, and while EV sales have leveled off, they now represent approximately 8.2% of the market.
The Opportunity for Credit Unions
Molnar, who said he expects to see more MSRP increases in the second half of this year, said there is a strong opportunity for credit unions as a result of the decline of incentives and attractive rates on loans.
Other Data Points
Other data points touched on by Molnar included:
Dealer Profits
Molnar said dealer profit margins have steadily declined in recent years, from a high of around 7.7% in May of 2022 to approximately 1.8% in May of 2025. Dealer F&I income remains strong, the J.D. Power data show, and has been rising in 2025.
“Dealers aren’t able to markup as much on the front end, but they are making a healthy profit on the backend,” said Molnar.
Upside-Down Buyers
The market is continuing to see a normalization of buyers with negative equity on trade-ins, with approximately 25.2% of buyers in a negative position on their trade-ins in May, according to J.D. Power.
The average monthly vehicle payment has now risen to $749.
Captive Share and Buy-Rate Gap
According to Molnar, in May of 2024 captive market share was near an all-time high, as captive lenders bought down rates. The buy-rate gap is now 120 BPs between the rates offered by captives and the rates of banks/credit unions, which has led to lower marketshare for captives, with the captives’ share of new vehicle loans down nine percentage points as a result.
Length of Terms
In terms of risk metrics, Molnar said the shift to longer-term loans is apparent, with one in five loans now at 84 months. Credit unions have gained share across all term buckets, he said.
Molnar added that what’s worth watching is the percentage of new loans with 84 month terms and greater than 110% LTV, which is now around 10.6% of loans.
“You’re probably never going to be in a very strong position on that vehicle.”

Used Vehicles
Other data points related to the used vehicle market as shared by Molnar included:
- The same credit score dynamics seen in the new market can be seen in the used market, with subprime borrowers again showing gain shares.
- The average new vehicle price, which was at a high of $41,100 in May of 2022, is now $29,400, which reflects a price increase. The average age of used vehicles in May of 2024 was 4.9 years old at franchised dealerships.
- The lack of leasing incentives from several years ago can now be seen in the decline in used vehicles available, and also means fewer returning lessees to purchase new cars. Molnar noted the number of returned leases is expected to continue to decline until the second quarter of 2026