
ALEXANDRIA, Va.—The new NCUA Quarterly U.S. Map Review for the second quarter of 2025 reveals that nationally assets in federally insured credit unions increased by 2.3% at the median over the year ending in the second quarter of 2025 (meaning) half of all federally insured credit unions had asset growth at or above 2.3% and half had asset growth of 2.3% or less, while the median growth rate in assets was negative 0.2%.
In the NCUA data, four-quarter growth is the growth from the end of the second quarter of 2024 through the second quarter of 2025. The agency noted that most of the maps shown in the review below reflect medians, or the 50th%ile of the distribution of the variable. In other words, for a given metric, half of all credit unions had a value at or above the median, while the other half had a value that was less than or equal to the median, NCUA said.
Here is how credit unions performed by category:

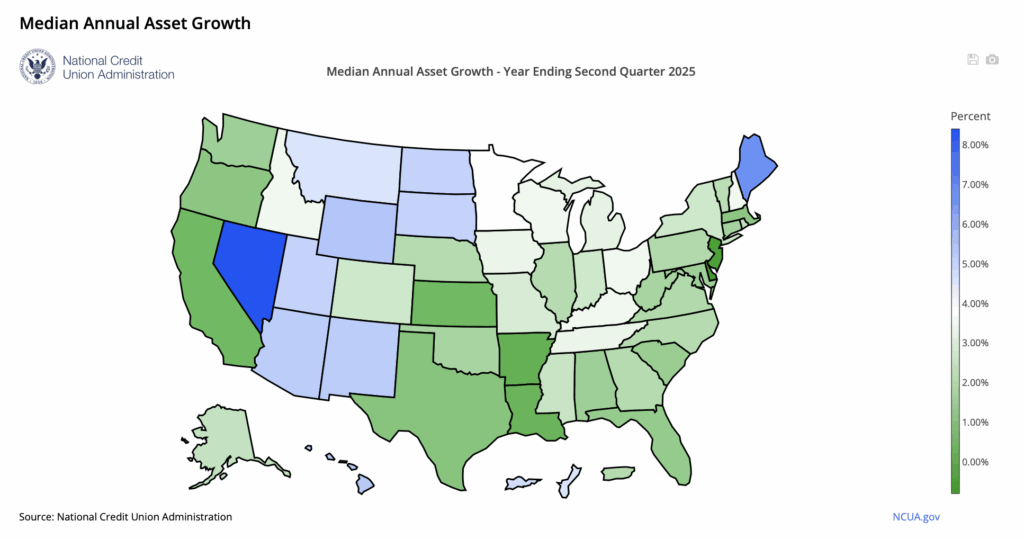
Median Annual Asset Growth
In addition to the above:
- Over the year ending in the second quarter of 2025, median asset growth was fastest in Nevada (8.4%) and Maine (6.7%).
- At the median, assets declined in Delaware (-0.8%) and New Jersey (-0.3%) over the year.
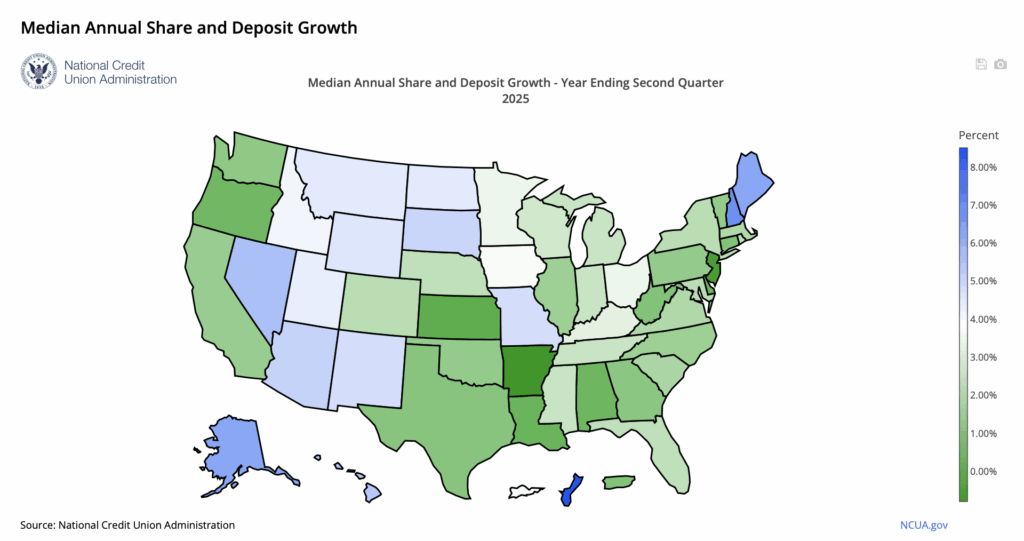
Median Annual Share and Deposit Growth
- Nationally, shares and deposits increased by 2.2% at the median over the year ending in the second quarter of 2025. During the year ending in the second quarter of 2024, the median growth rate in shares and deposits was negative 1.2%.
- Over the year ending in the second quarter of 2025, median growth in shares and deposits was fastest in New Hampshire (6.8%), followed by Alaska and Maine (both 6.2%).
- At the median, shares and deposits declined in Arkansas (-0.8%) and New Jersey (-0.4%) over the year.
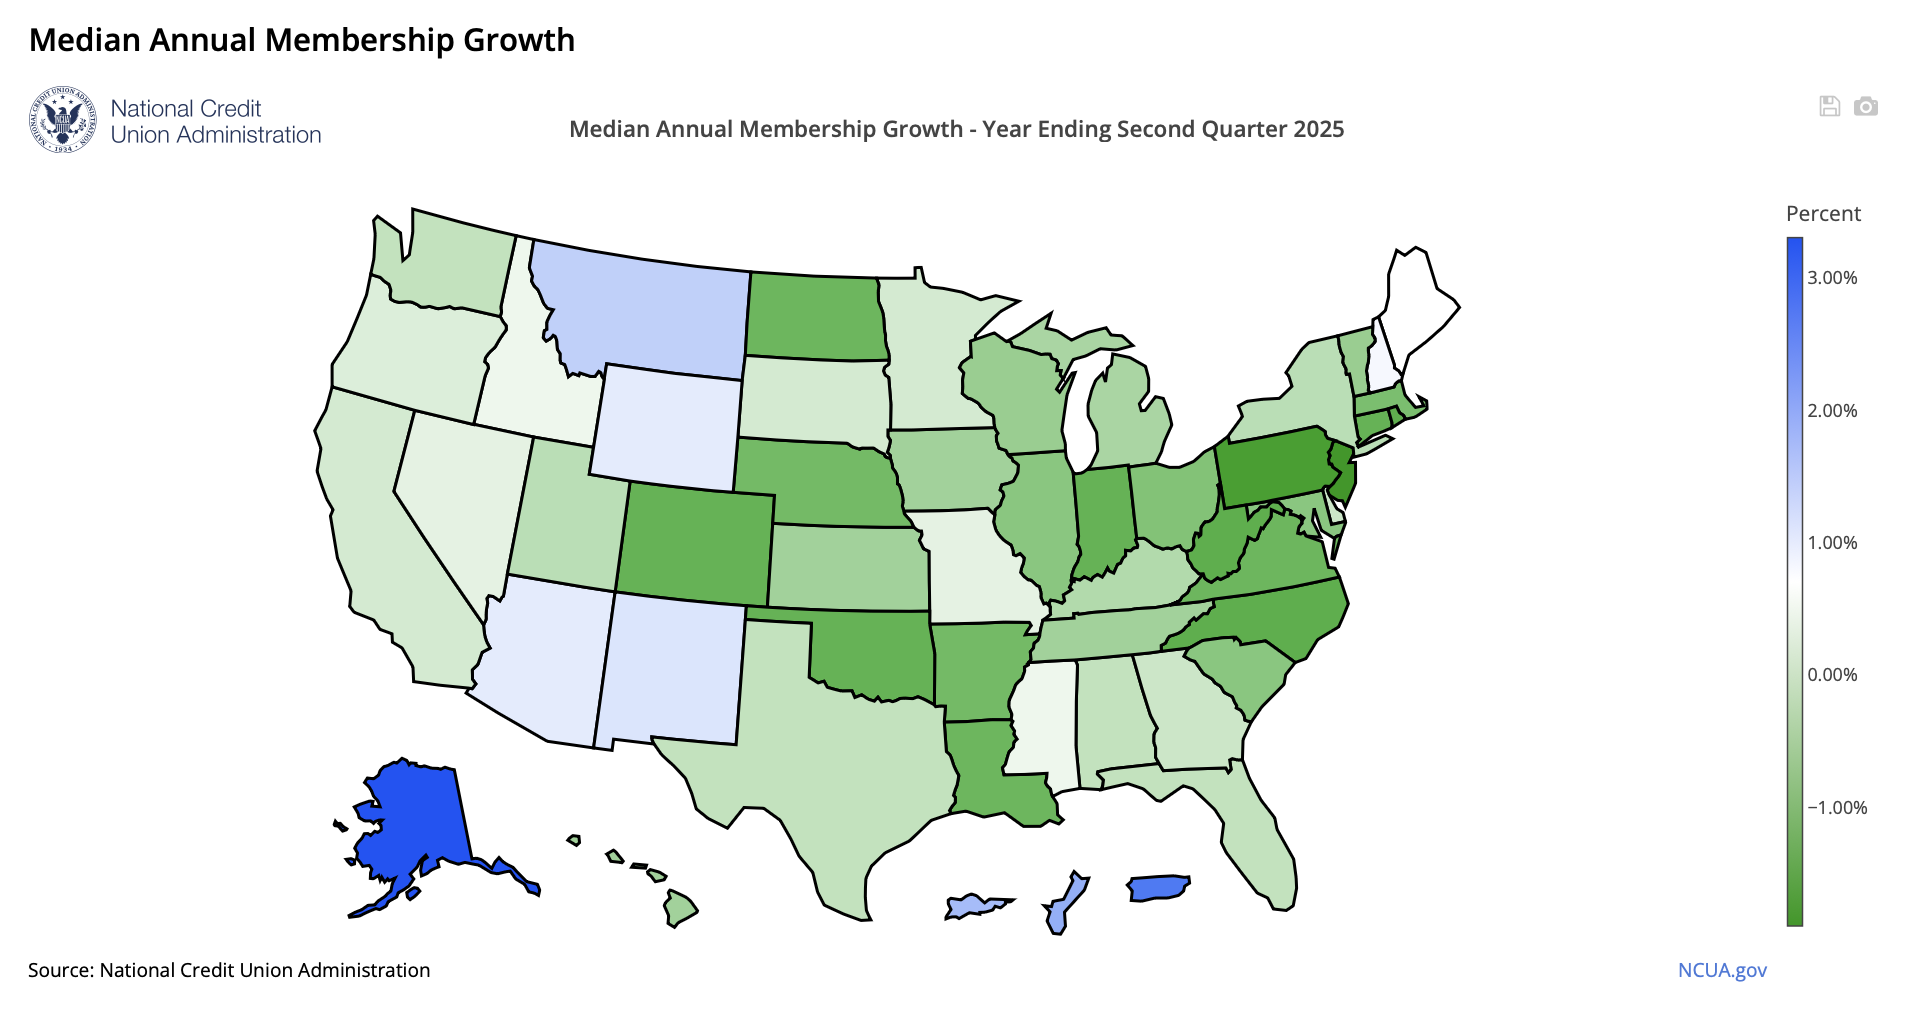
Median Annual Membership Growth
- While membership continued to grow in the aggregate over the year ending in the second quarter of 2025, at the median, membership declined by 0.5%. Membership declined by 0.3% at the median over the year ending in the second quarter of 2024. Overall, about 55% of federally insured credit unions had fewer members at the end of the second quarter of 2025 than a year earlier. Credit unions with falling membership tend to be small; over half had less than $50 million in assets in the second quarter of 2025.
- Over the year ending in the second quarter of 2025, credit unions headquartered in Alaska (3.3%) and Montana (1.4%) experienced the strongest median membership growth.
- At the median, membership declined in 30 states and Washington, D.C. over the year. New Jersey (-1.9%) and Pennsylvania (-1.7%) saw the largest median decline in membership.
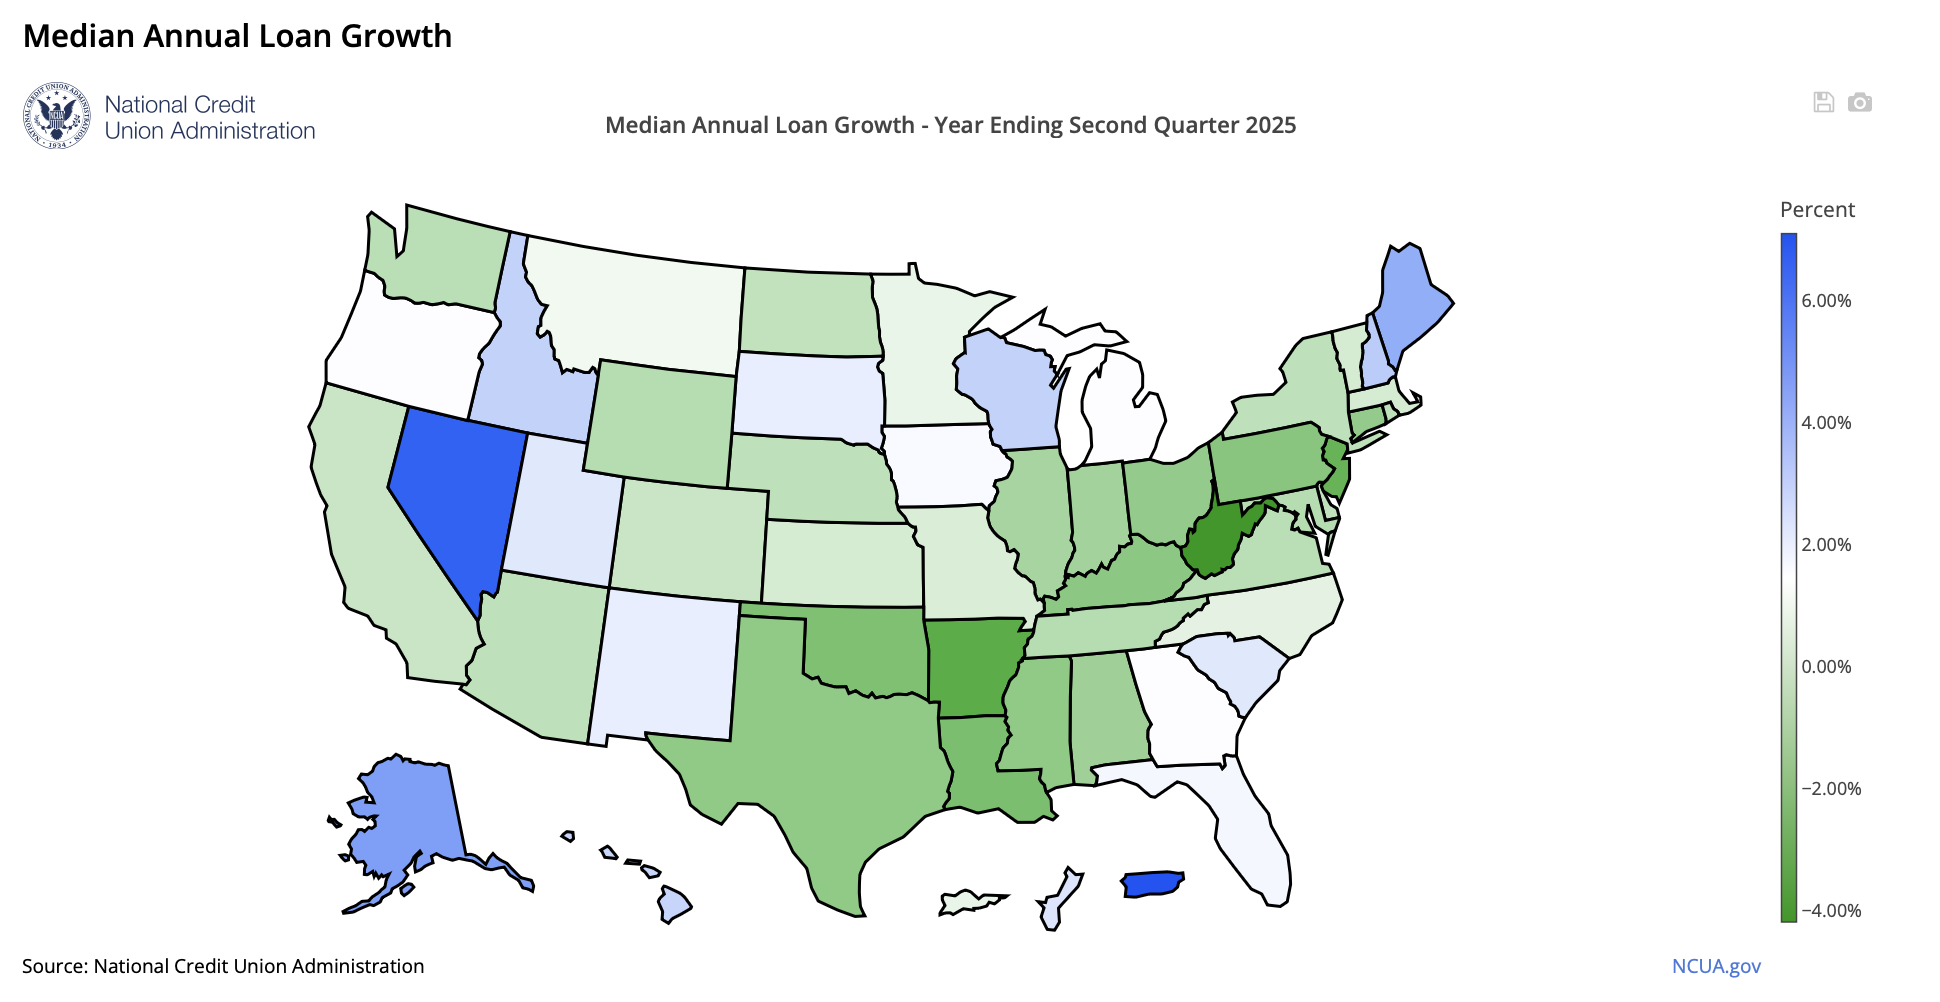
Median Annual Loan Growth
- Nationally, loans outstanding declined by 0.2% at the median over the year ending in the second quarter of 2025. Over the previous year, loans increased by 2.4% at the median.
- Over the year ending in the second quarter of 2025, median loan growth was strongest in Nevada (6.6%) and Alaska (4.6%).
- At the median, loans outstanding declined in Washington, D.C. and twenty-five states over the year, led by West Virginia (-4.2%) and Arkansas (-3.0%).
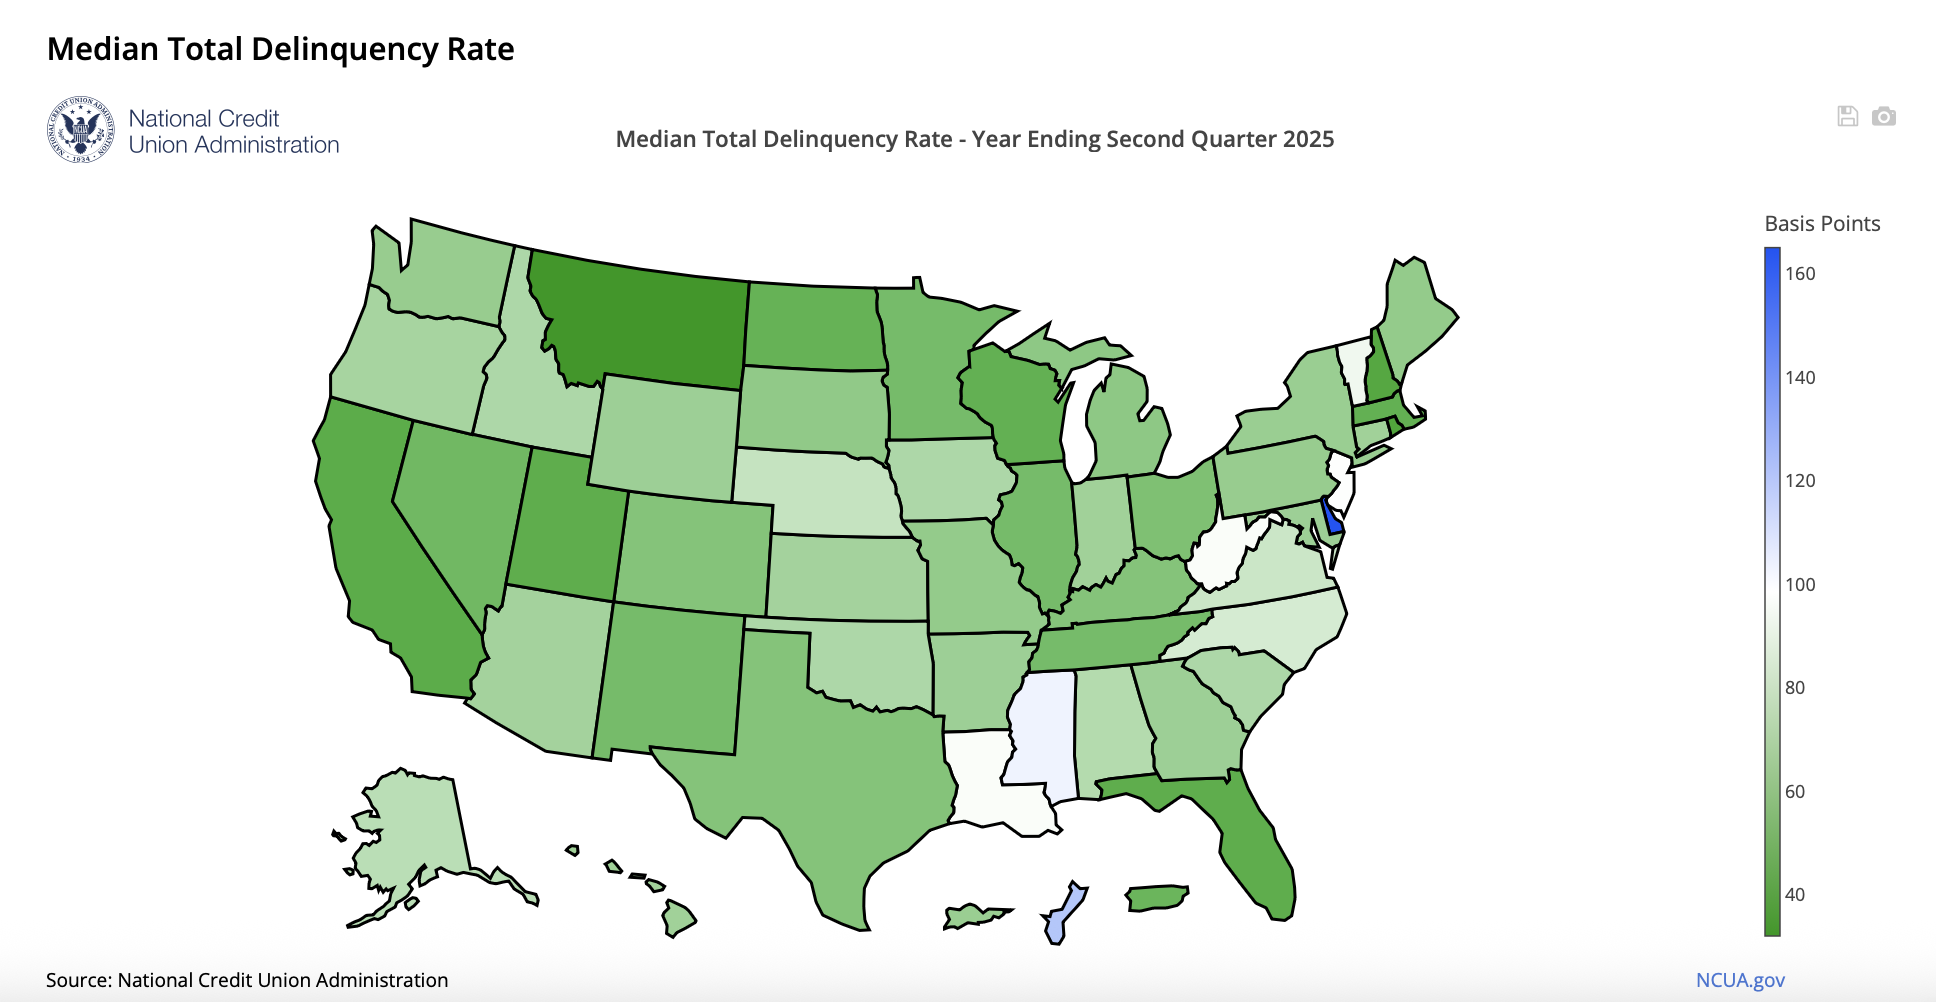
Median Total Delinquency Rate
- At the end of the second quarter of 2025, the median total delinquency rate among federally insured credit unions was 65 basis points, compared with 60 basis points at the end of the second quarter of 2024.
- At the end of the second quarter of 2025, the median delinquency rate was highest in Delaware (165 basis points) and Mississippi (103 basis points).
- The median delinquency rate was lowest in Montana (32 basis points) and Rhode Island (41 basis points) at that time.
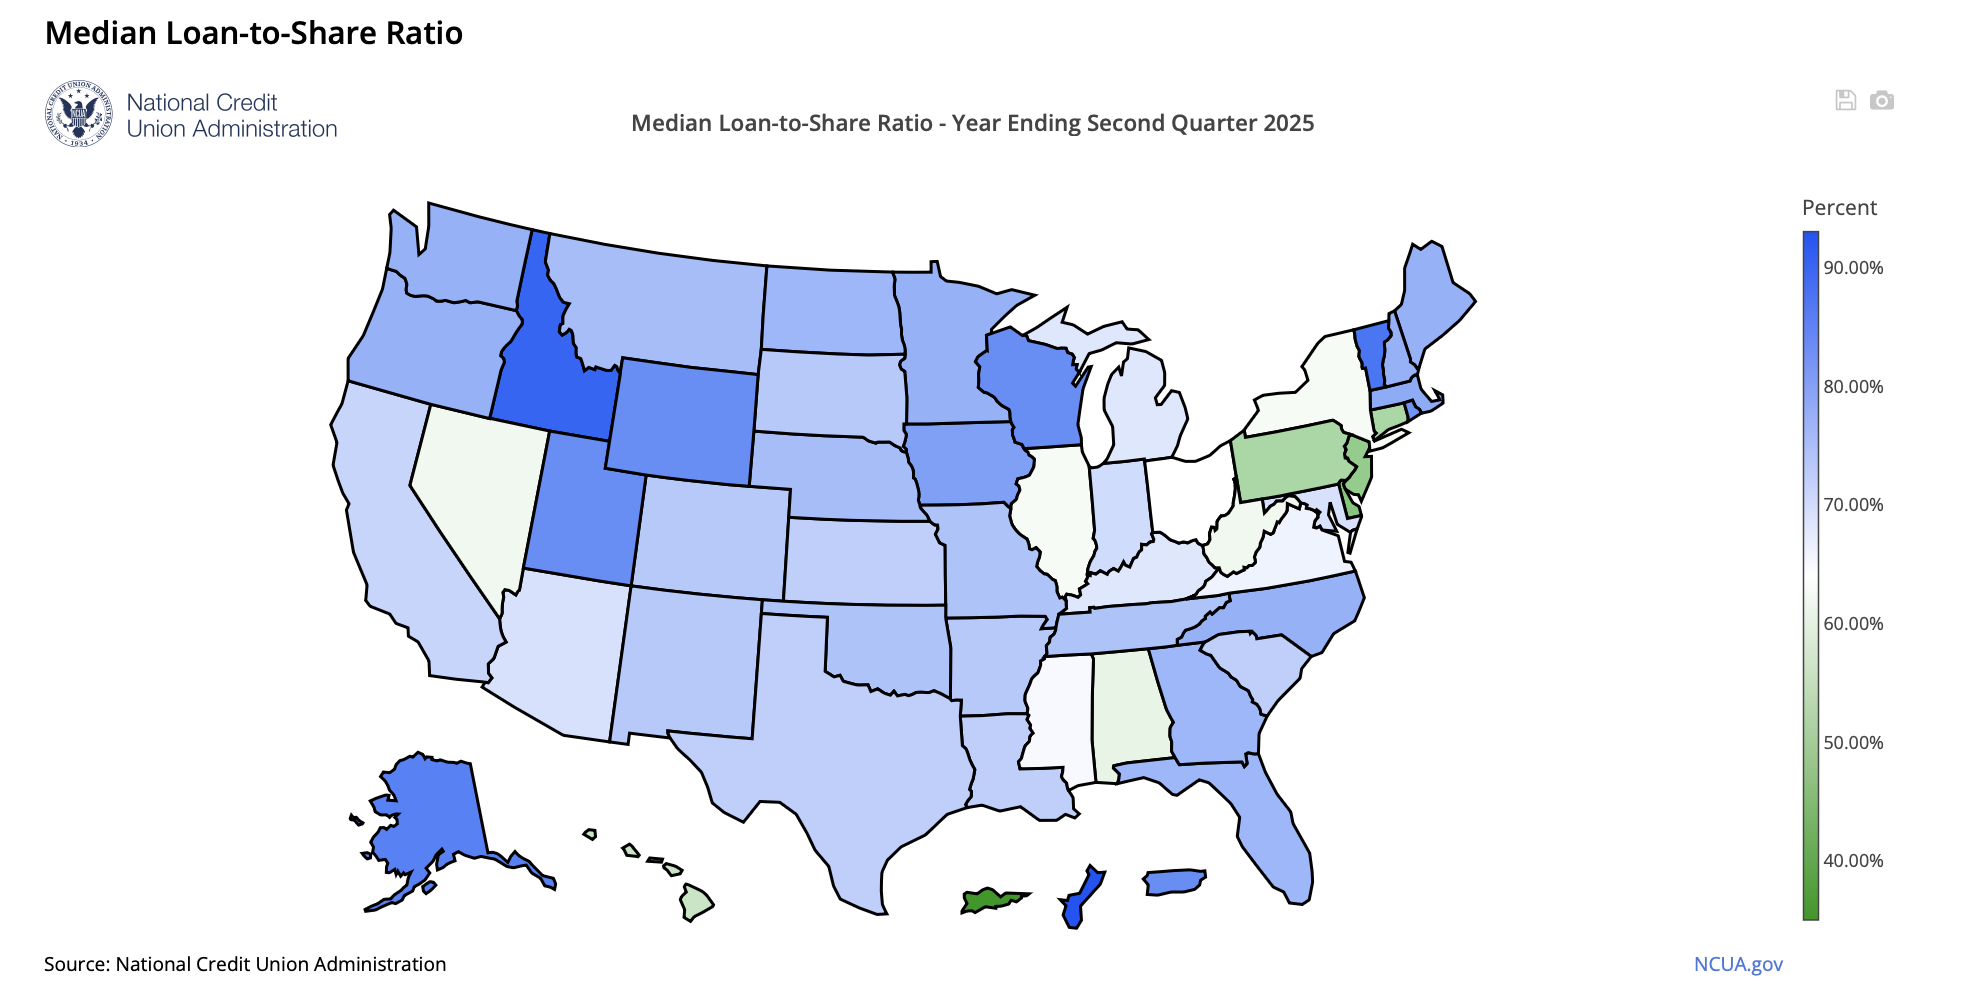
Median Loan-to-Share Ratio
- Loan-to-share ratios are rounded to the nearest percentage point.
- Nationally, the median ratio of total loans outstanding to total shares and deposits – the loan-to-share ratio – was 70% at the end of the second quarter of 2025. At the end of the second quarter of 2024, the median loan-to-share ratio was 71%.
- Vermont (87%) had the highest ratio at the end of the second quarter of 2025.
- The median loan-to-share ratio was lowest in Delaware (48%) and New Jersey (50%) at that time.
Median Return on Average Assets
- Nationally, the median annualized return on average assets at federally insured credit unions was 71 basis points in the first half of 2025, compared with 61 basis points in the first half of 2024.
- Nevada and Wyoming (both 123 basis points) had the highest median annualized return on average assets in the first half of 2025, followed by South Dakota (102 basis points).
- Colorado and New Jersey (both 45 basis points) had the lowest median annualized return on average assets at that time, followed by Delaware and Washington, D.C. (both 46 basis points).
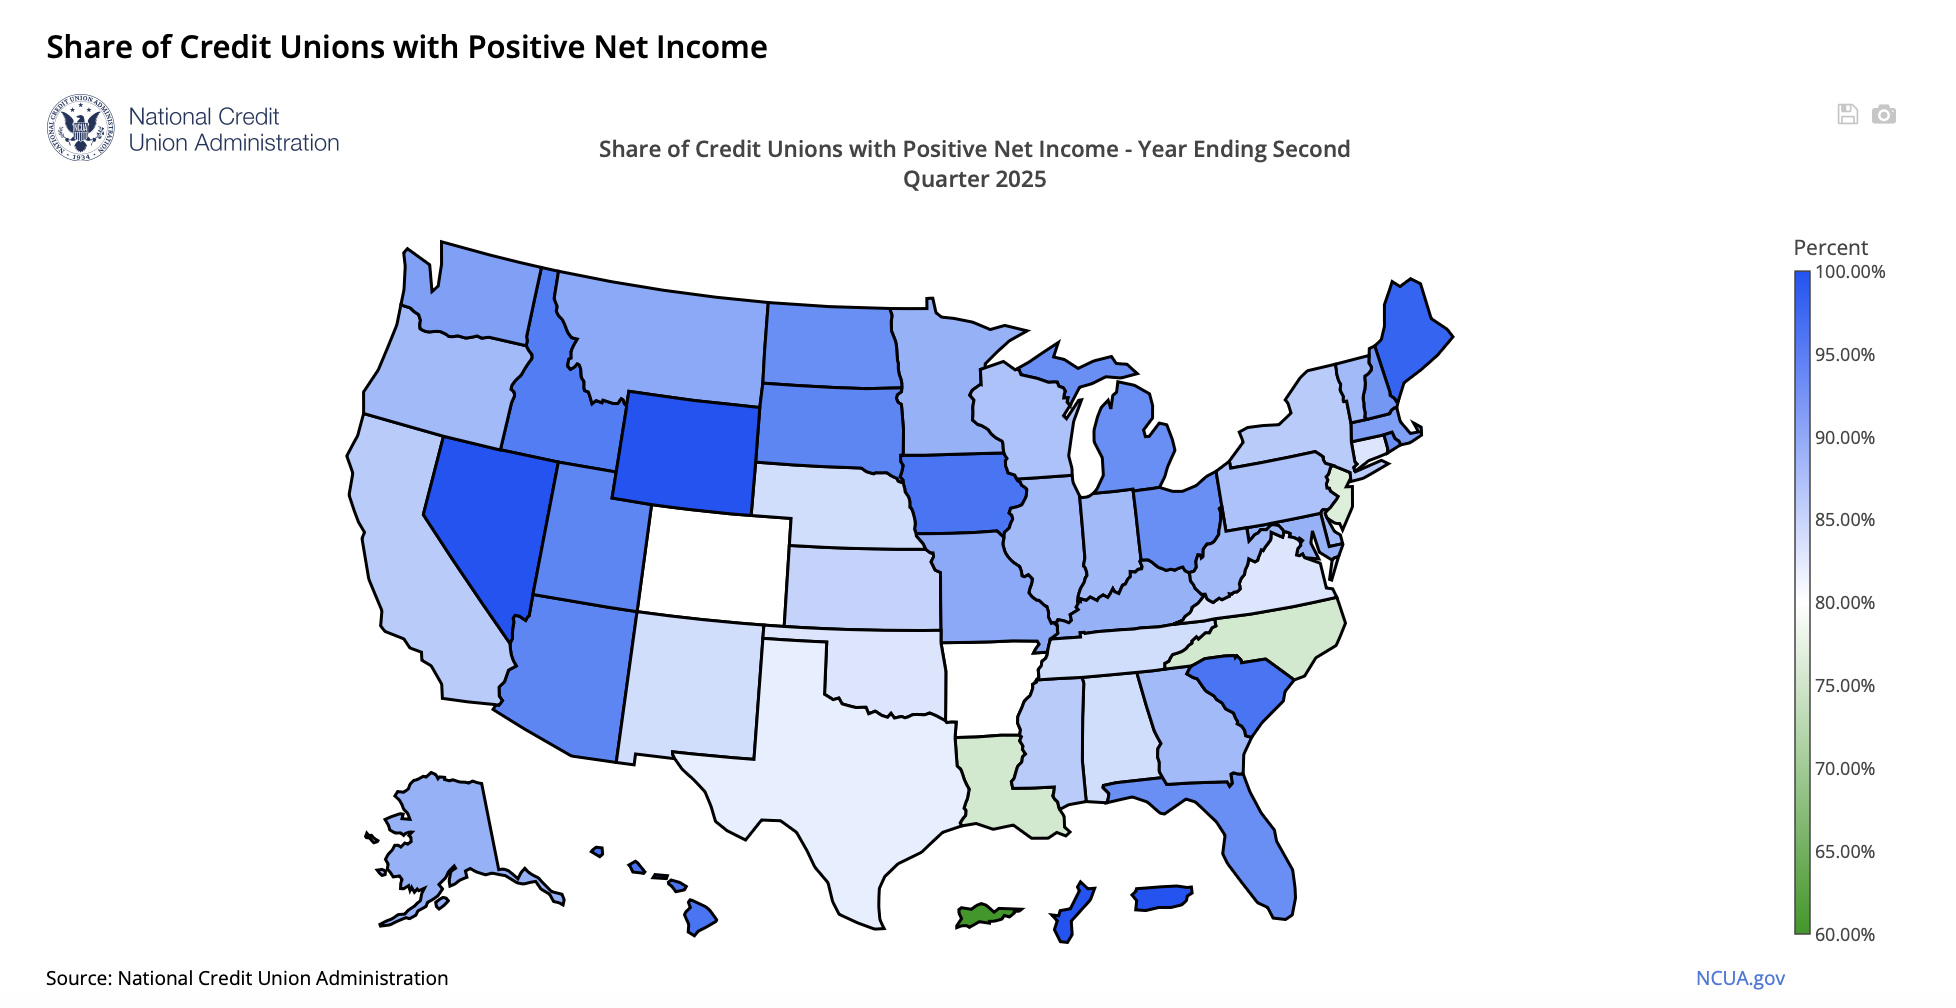
Share of Credit Unions with Positive Net Income
NCUA noted shares of credit unions with positive net income are rounded to the nearest percentage point.
- Nationally, 87% of federally insured credit unions had positive year-to-date net income in the second quarter of 2025, compared with 84% in the second quarter of 2024.
- In the second quarter of 2025, the share of federally insured credit unions with positive year-to-date net income was highest in Nevada and Wyoming (both 100%), followed by Maine (98%).
- The share was lowest in Washington, D.C. (73%) at that time, followed by Louisiana and North Carolina (both 76%).
About the Data
NCUA makes information about the financial performance of federally insured credit unions available through its online Research a Credit Union(Opens new window) tool. Through this link, you can locate information contained in an individual credit union’s Call Report as well as obtain a Financial Performance Report and summary documents about a credit union’s performance. For comments or suggestions about the NCUA Quarterly U.S. Map Review, please send an email to [email protected].