WASHINGTON — Federally insured credit unions posted stronger growth in assets, deposits and loans during the year ending in the first quarter of 2026, while profitability improved and the vast majority of institutions remained in the black, according to new state-level and systemwide data released by the National Credit Union Administration.
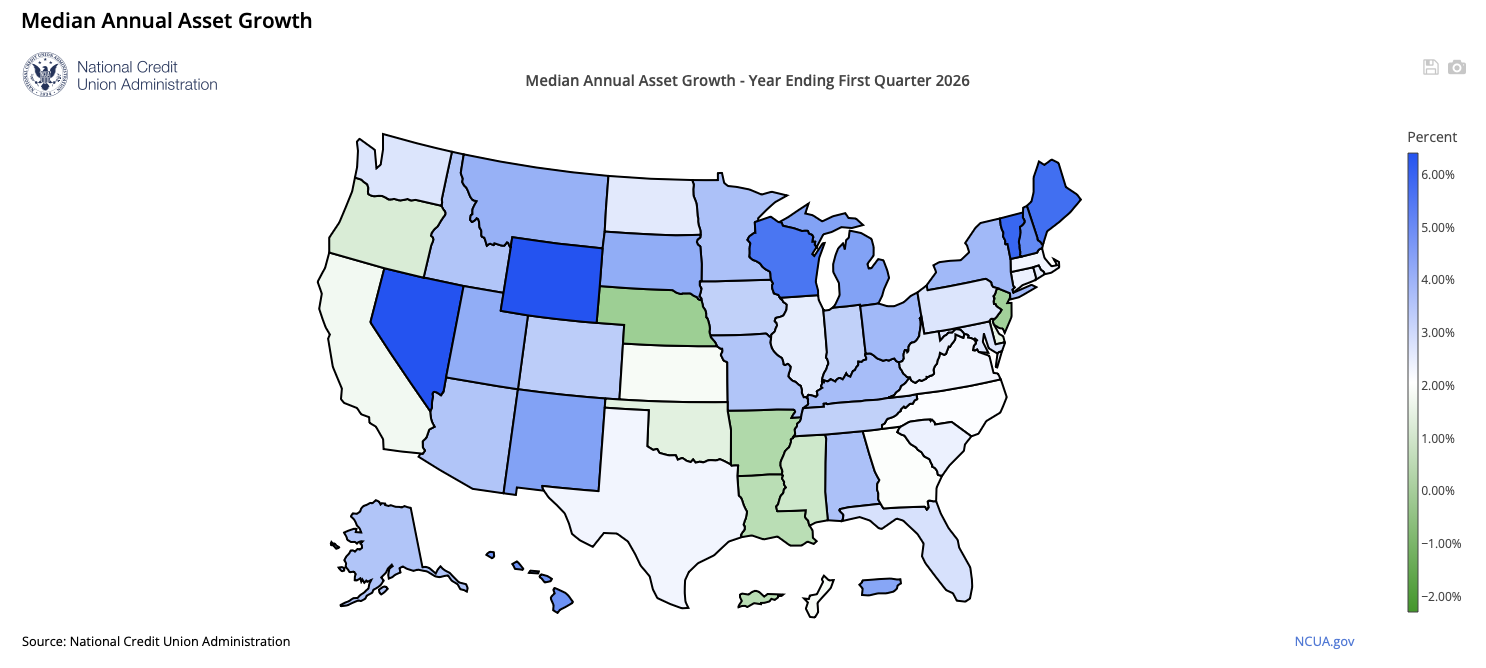
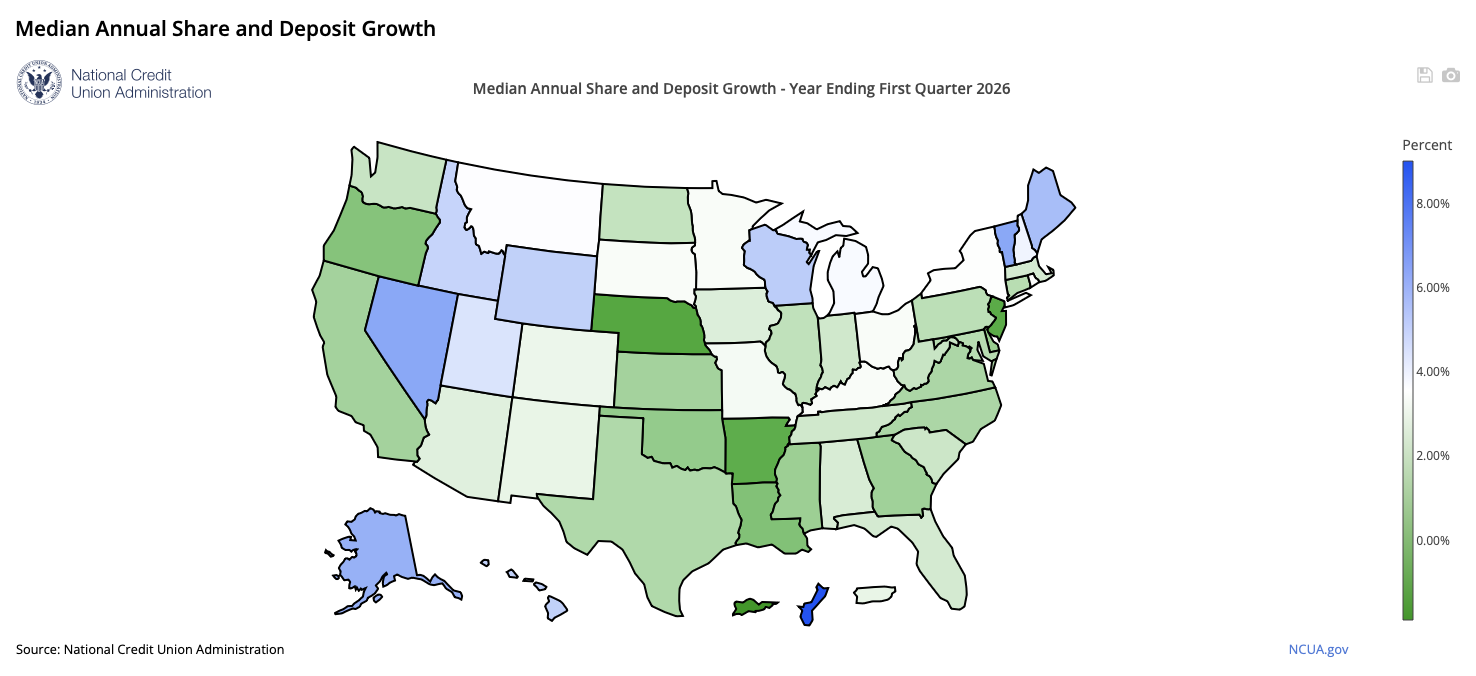
The NCUA’s Quarterly U.S. Map Review found median asset growth among federally insured credit unions reached 3.8% nationally during the 12 months ending March 31, 2026, up sharply from 1.2% during the same period a year earlier. Median growth in shares and deposits also accelerated to 3.6%, compared with 1.1% one year earlier, according to the agency.
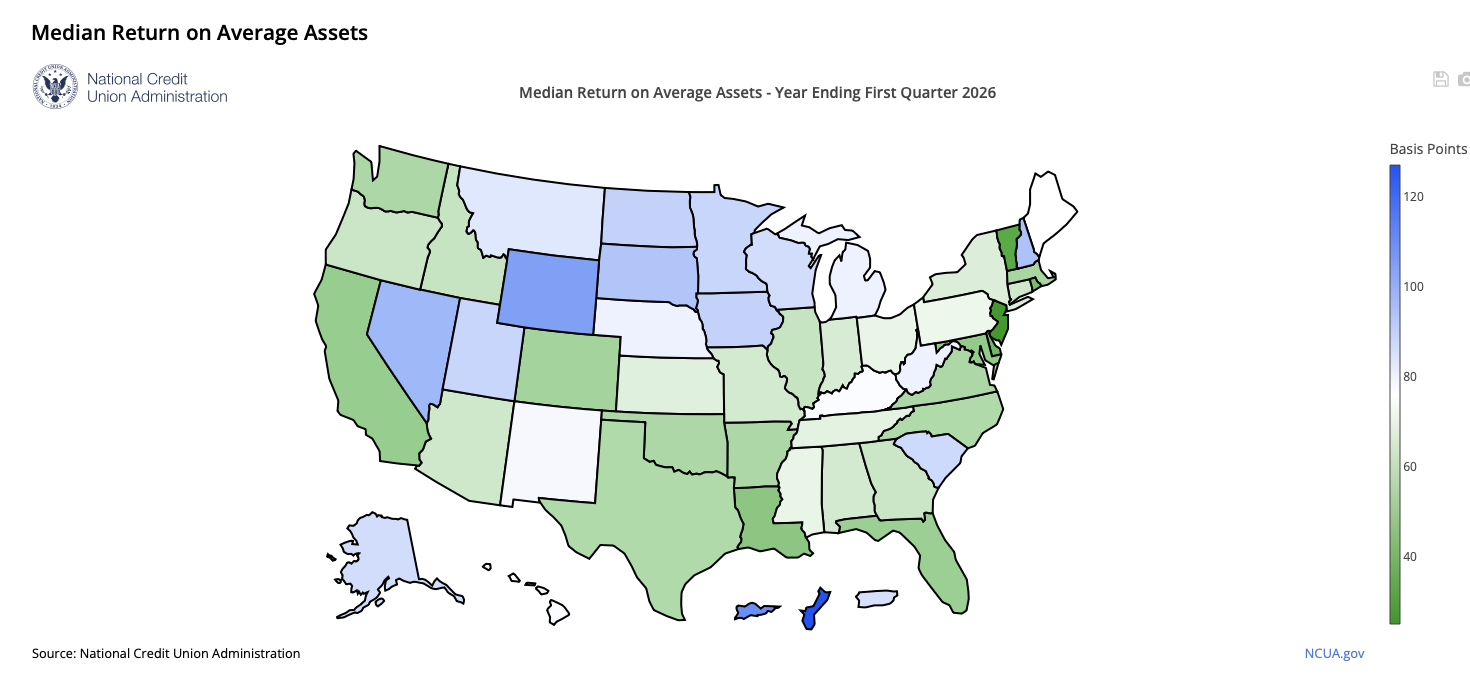
The report tracks key indicators of financial health and viability for federally insured credit unions in all 50 states and the District of Columbia, including asset growth, deposit growth, membership trends, loan growth, delinquency rates, earnings, unemployment rates and home-price changes.

The Overall Nunbers
According to the NCUA’s first-quarter data:
- Median asset growth: 3.8%
- Median shares and deposit growth: 3.6%
- Total credit union assets: $2.48 trillion
- Total loans outstanding: $1.73 trillion
- Insured shares and deposits: $1.91 trillion
- Average loan balance: $19,557
- Net worth: $279.2 billion
- Net worth ratio: 11.24%
- Annualized net income: $20.4 billion
- Credit union delinquency rate: 85 basis points
- Net charge-off ratio: 81 basis points
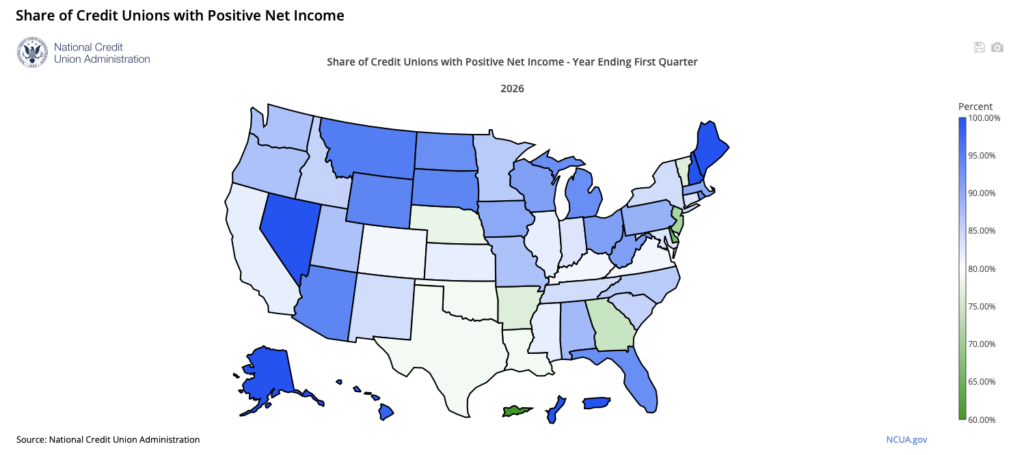
- Share of credit unions reporting positive earnings: 88%
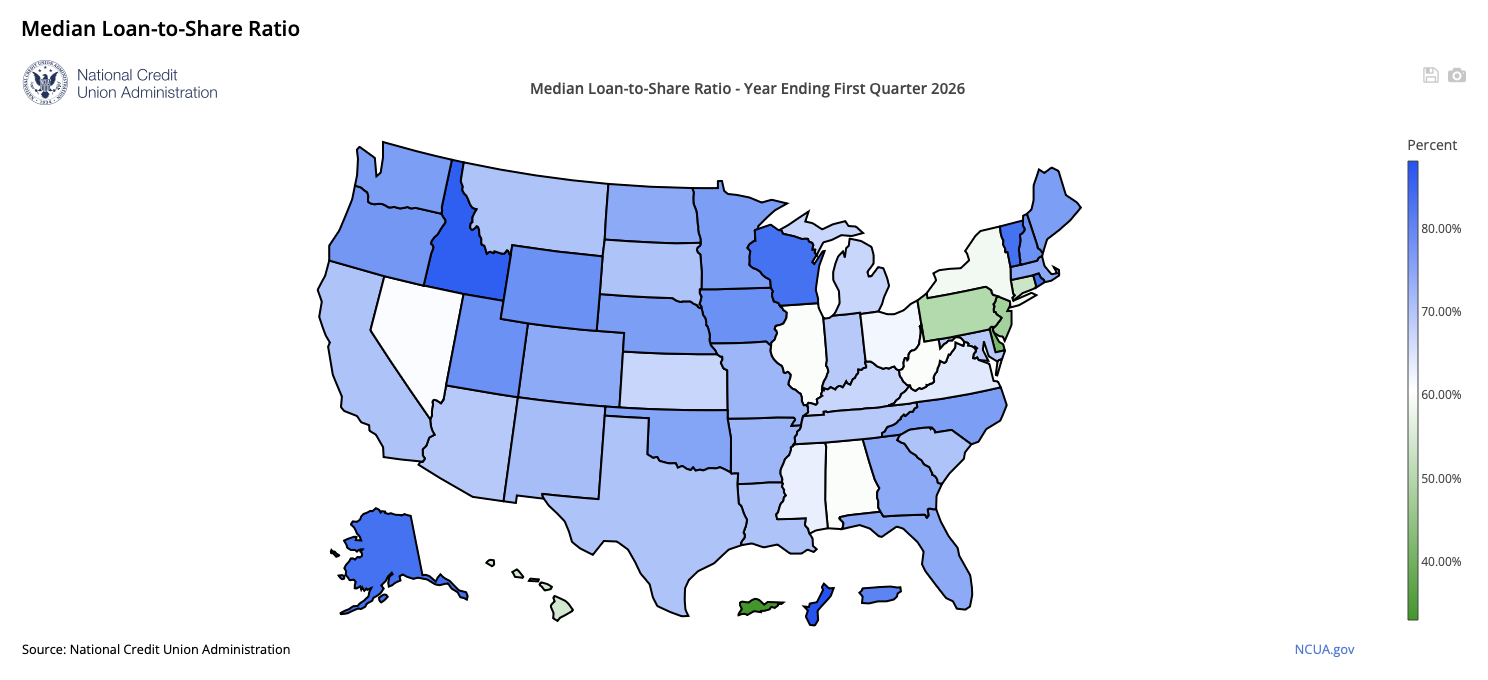
- Median loan-to-share ratio: approximately 70%
Balance Sheets Continue to Expand
The NCUA said growth improved across most major categories during the year.
Nationally, median asset growth reached 3.8%, while median shares and deposit growth climbed to 3.6%. The increases reflect stronger balance-sheet growth after a period of slower expansion during 2024 and early 2025.
Separate first-quarter performance data released by the NCUA show total assets in federally insured credit unions rose by $117 billion, or 4.9%, to $2.48 trillion. Insured shares and deposits increased by $76 billion, or 4.2%, to $1.91 trillion.
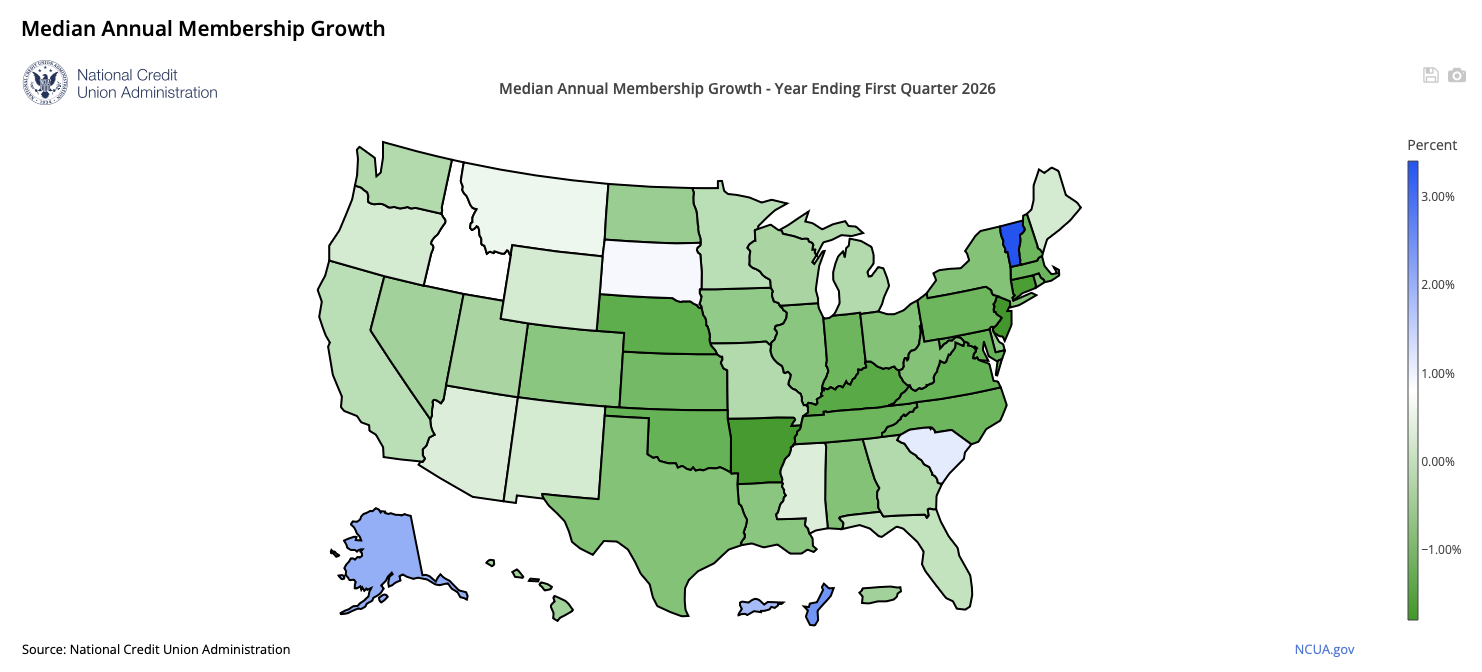
Membership Remains a Challenge
While overall credit union membership continues to increase nationally, the median credit union is still struggling to grow membership.
The NCUA reported that membership growth remained uneven across the country, continuing a trend seen in recent quarters. Earlier NCUA data showed approximately 55% of federally insured credit unions had fewer members than a year earlier, despite overall system membership growth being positive.
The divergence highlights the continuing challenge many smaller and mid-sized institutions face in attracting and retaining members as industry consolidation continues.
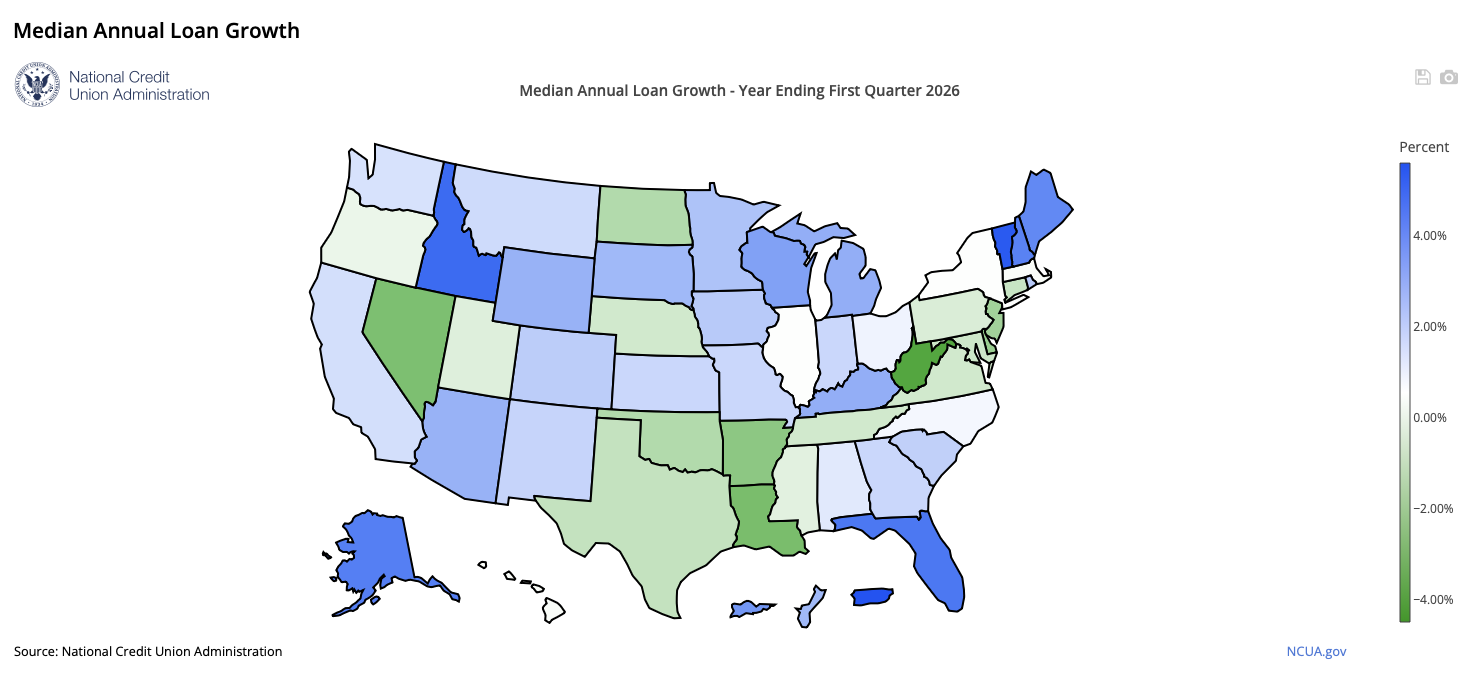
Loan Growth Improves
Credit unions also continued to expand lending activity.
The NCUA reported positive median loan growth nationally, while the median loan-to-share ratio remained around 70%, indicating institutions continued putting deposits to work through lending.
Systemwide, total loans outstanding increased by $76 billion, or 4.6%, over the year to $1.73 trillion. The average outstanding loan balance reached $19,557, an increase of $858, or 4.6%, from one year earlier.
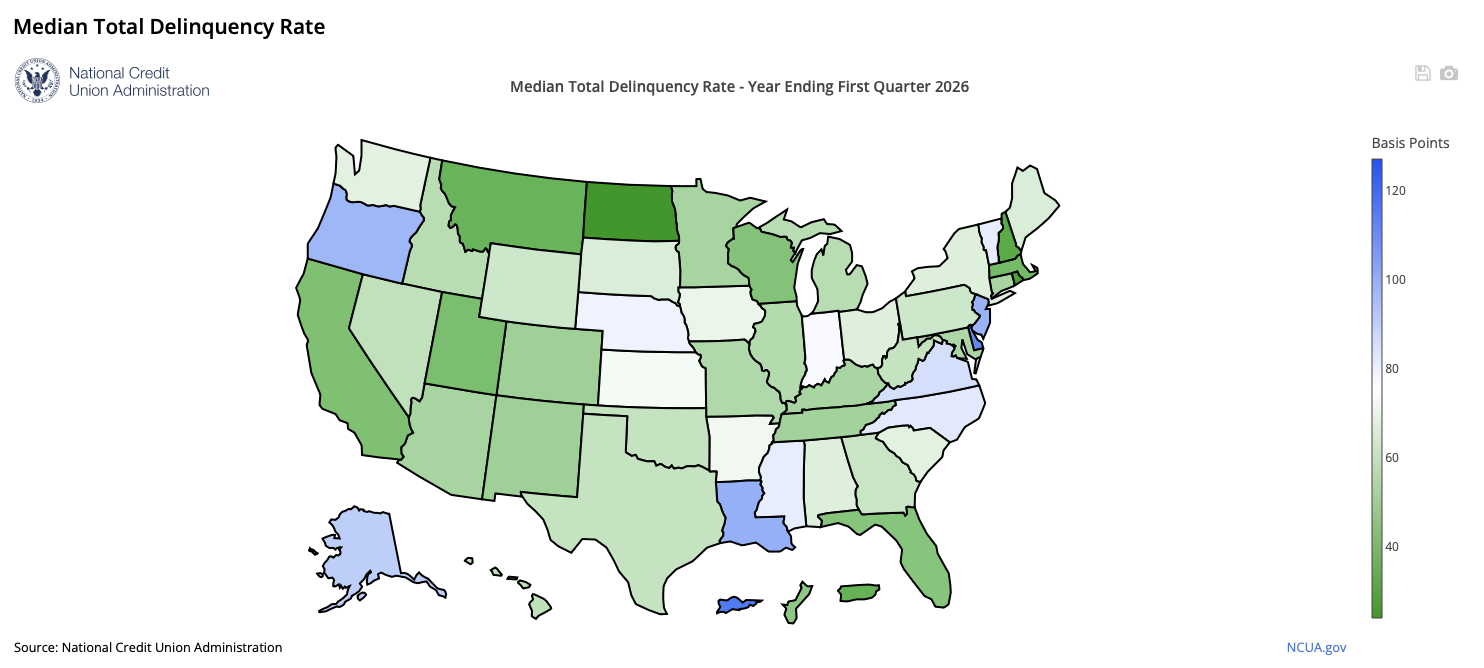
Asset Quality Mixed but Stable
The Quarterly U.S. Map Review found delinquency rates remained manageable nationally, though conditions varied significantly by state.
Systemwide, the delinquency rate stood at 85 basis points during the first quarter, up five basis points from a year earlier. However, the net charge-off ratio improved to 81 basis points, down two basis points year-over-year.
Among loan categories:
- Non-commercial real estate loan delinquency rose to 63 basis points, up nine basis points from a year earlier.
- Credit card delinquency increased two basis points to 204 basis points.
- Auto-loan delinquency was essentially unchanged at 80 basis points.
- Commercial-loan delinquency rose to 101 basis points, up eight basis points from the first quarter of 2025.
Earnings Strengthen
The report also found profitability improved across the credit union system.
Countrywide, approximately 88% of federally insured credit unions reported positive year-to-date net income, up from 86% a year earlier.
Systemwide net income increased 30.5% to an annualized $20.4 billion during the first quarter. Interest income rose $8 billion, or 6.7%, to an annualized $126.4 billion, while interest expense declined by $1.1 billion, or 2.5%, to an annualized $41.8 billion. Non-interest income increased 3.7% to an annualized $25.5 billion.
At the same time, non-interest expenses increased 7.6% to an annualized $76.9 billion.
Capital Position Improves
The NCUA said credit unions continued to strengthen capital levels during the quarter.
The system’s aggregate net worth increased by $19.9 billion, or 7.7%, to $279.2 billion. The aggregate net worth ratio improved to 11.24%, up from 10.95% one year earlier. The prompt corrective action net worth ratio stood at 11.29%.
Economic Conditions Continue to Influence Results
The Quarterly U.S. Map Review also incorporates state-level economic indicators, including unemployment rates and home-price trends, which the agency said continue to affect credit union performance across the country. Economic conditions, housing markets and employment trends all contributed to varying results among states.
The Quarterly U.S. Map Review is produced by the NCUA’s Office of the Chief Economist and provides a state-by-state snapshot of the financial condition and performance of federally insured credit unions nationwide.