
ALEXANDRIA, Va.–Nationally, assets in federally insured credit unions increased by 2.9% at the median over the year ending in Q2 of 2026, while the median ratio of total loans outstanding to total shares and deposits was 69%, as of NCUA’s new Q2 U.S. Map Review.
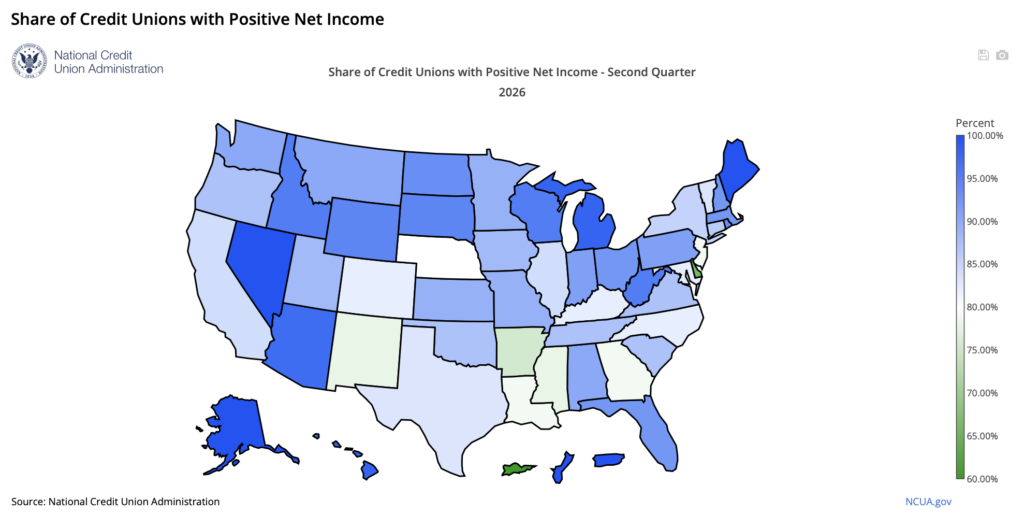
The report also shows that while membership continued to grow in the aggregate over the year ending in the second quarter of 2026, at the median, membership declined by 0.6%. Nationally, 87% of federally insured credit unions had positive year-to-date net income in the second quarter of 2026.
Here’s how credit unions performed by category, according to NCUA:
Median Asset Growth
Highlights
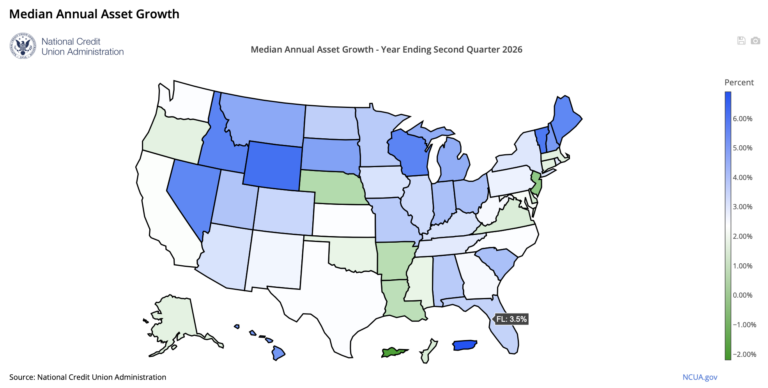
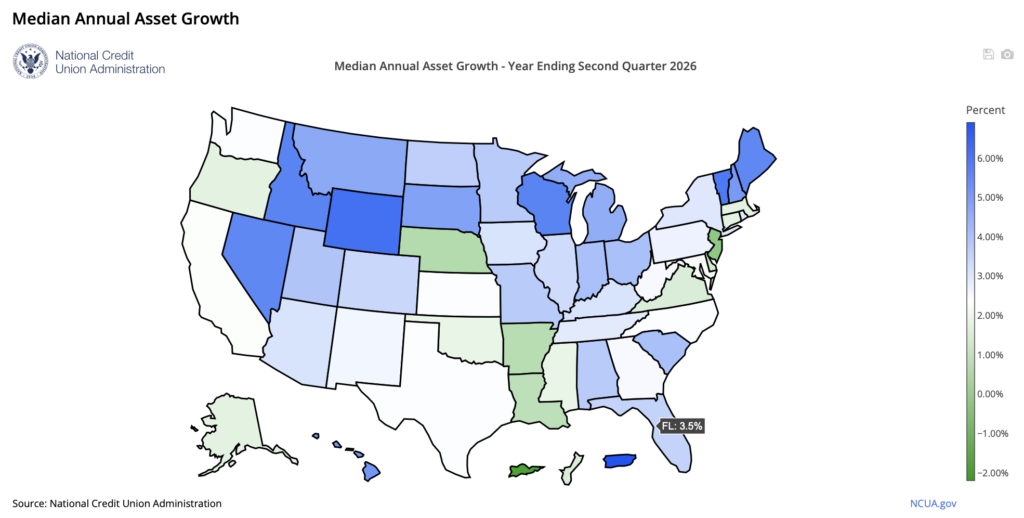
- Nationally, assets in federally insured credit unions increased by 2.9% at the median over the year ending in the second quarter of 2026. In other words, half of all federally insured credit unions had asset growth at or above 2.9% and half had asset growth of 2.9% or less. During the year ending in the second quarter of 2025, the median growth rate in assets was 2.3%.
- Over the year ending in the second quarter of 2026, median asset growth was fastest in Wyoming (6.1%) and Vermont (5.9%).
- At the median, assets declined in Washington, D.C. (-2.2%) and were roughly unchanged in New Jersey over the year.
Median Annual Share and Deposit Growth
Highlights
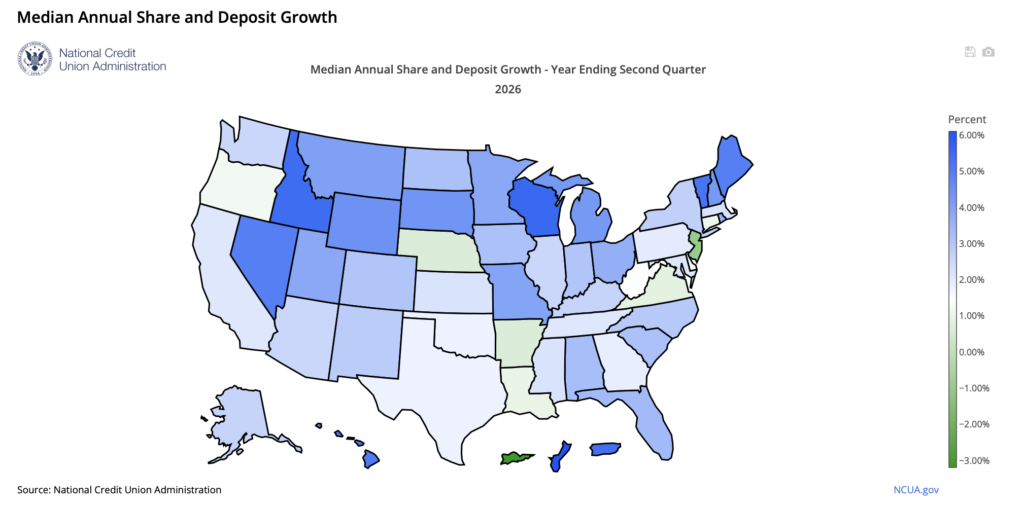
- Nationally, shares and deposits increased by 2.5% at the median over the year ending in the second quarter of 2026. During the year ending in the second quarter of 2025, the median growth rate in shares and deposits was 2.2%.
- Over the year ending in the second quarter of 2026, median growth in shares and deposits was fastest in Wisconsin (5.5%) and Idaho (5.4%).
- At the median, shares and deposits declined in Washington, D.C. (-2.7%) and New Jersey (-0.8%) over the year.
Median Annual Membership Growth
Highlights
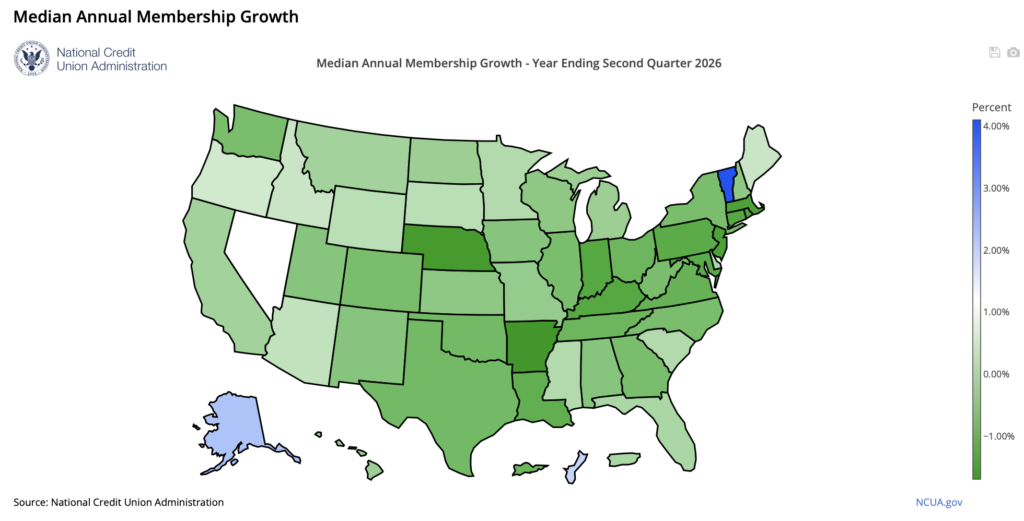
- While membership continued to grow in the aggregate over the year ending in the second quarter of 2026, at the median, membership declined by 0.6%. Membership declined by 0.5% at the median over the year ending in the second quarter of 2025. Overall, about 56% of federally insured credit unions had fewer members at the end of the second quarter of 2026 than a year earlier. Credit unions with falling membership tend to be small; over half had less than $50 million in assets in the second quarter of 2026.
- Over the year ending in the second quarter of 2026, credit unions headquartered in Vermont (4.1%) and Alaska (2.2%) experienced the strongest median membership growth.
- At the median, membership declined in thirty-four states over the year. Arkansas (-1.7%) and Nebraska (-1.6%) saw the largest median decline in membership.
Median Annual Loan Growth
Highlights
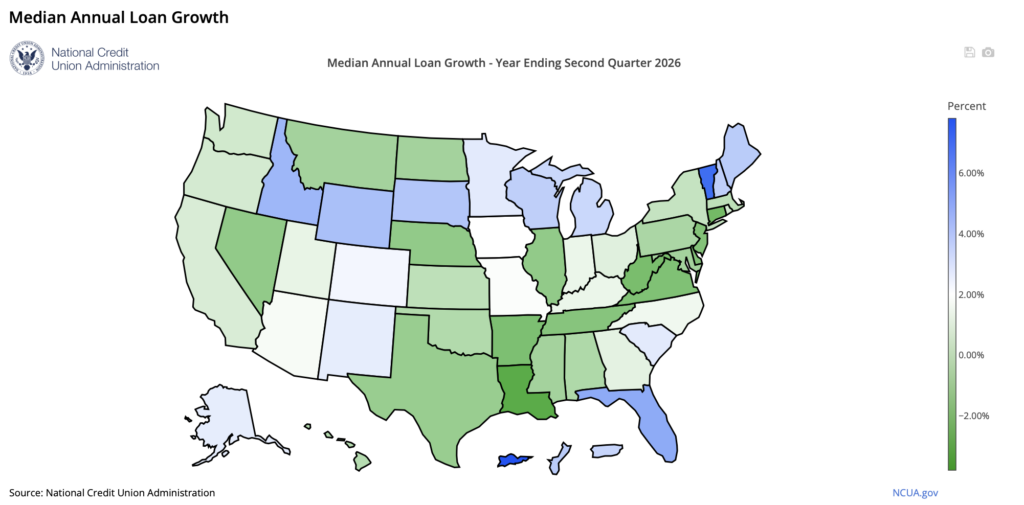
- Nationally, loans outstanding grew by 0.6% at the median over the year ending in the second quarter of 2026. Over the previous year, loans declined by 0.2% at the median.
- Over the year ending in the second quarter of 2026, median loan growth was strongest in Vermont (6.9%) and Florida (4.8%).
- At the median, loans outstanding declined in Washington, D.C. and eighteen states over the year, led by Washington, D.C. (-3.8%) and Louisiana ( 2.6%).
Median Total Delinquency Rate
Highlights
- At the end of the second quarter of 2026, the median total delinquency rate among federally insured credit unions was 69 basis points, compared with 65 basis points at the end of the second quarter of 2025.
- At the end of the second quarter of 2026, the median delinquency rate was highest in Washington, D.C. (141 basis points) and Vermont (129 basis points).
- The median delinquency rate was lowest in Montana (41 basis points) and New Hampshire (43 basis points) at the end of the second quarter of 2026.
Median Loan-to-Share Ratio
Highlights
Loan-to-share ratios are rounded to the nearest percentge point.
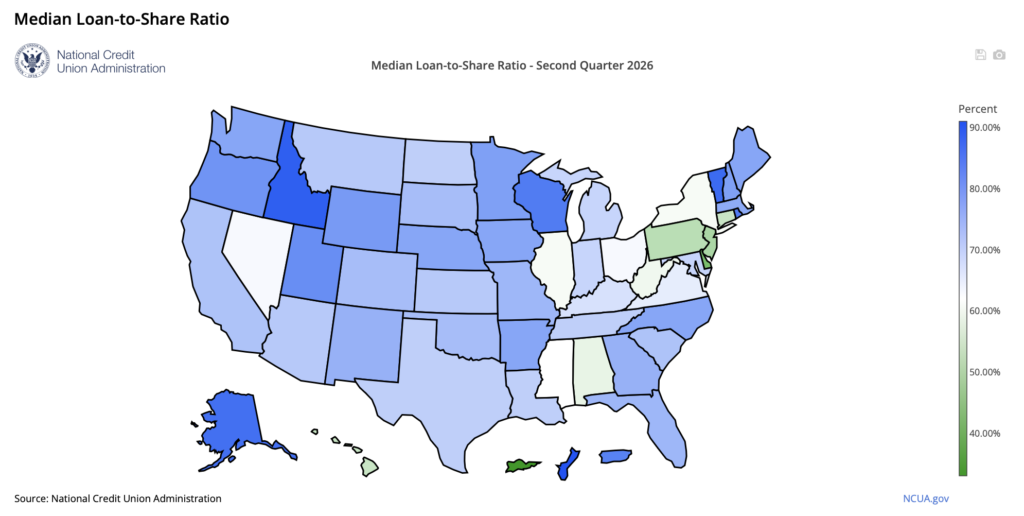
- Nationally, the median ratio of total loans outstanding to total shares and deposits—the loan-to-share ratio—was 69% at the end of the second quarter of 2026. At the end of the second quarter of 2025, the median loan-to-share ratio was 70%.
- The median loan-to-share ratio was highest in Idaho (89%) and Vermont (87%) at the end of the second quarter of 2026.
- The median loan-to-share ratio was lowest in Delaware (44%) and New Jersey (51%) at the end of the second quarter of 2026.
Median Return on Average Assets
Highlights
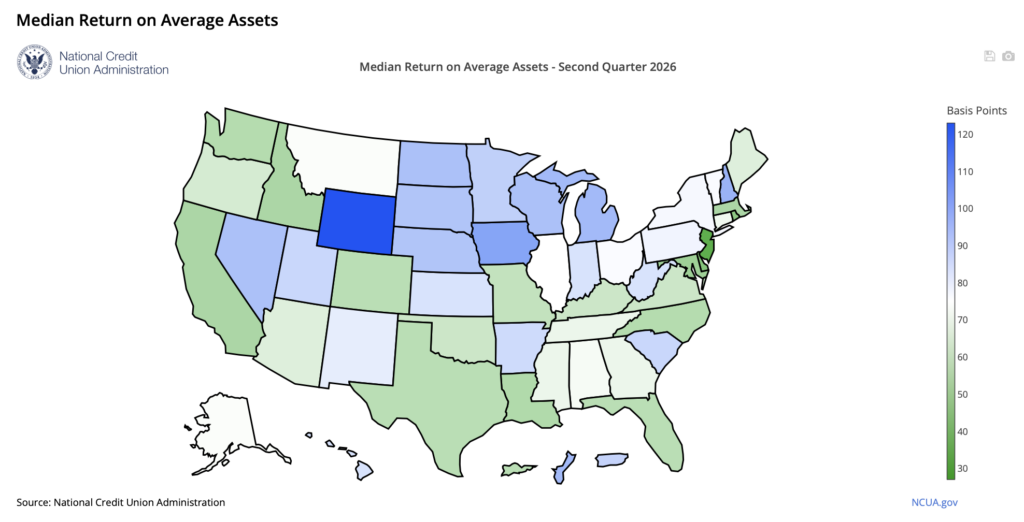
- Nationally, the median annualized return on average assets at federally insured credit unions was 71 basis points in the first half of 2026, matching its year-ago level.
- Wyoming (123 basis points) and Iowa (100 basis points) had the highest median annualized return on average assets in the first half of 2026.
- Washington, D.C. (27 basis points) and New Jersey (38 basis points) had the lowest median annualized return on average assets in the first half of 2026.
Share of Credit Unions with Positive Net Income
Highlights
Shares of credit unions with positive net income are rounded to the nearest percentage point.
- Nationally, 87% of federally insured credit unions had positive year-to-date net income in the second quarter of 2026, the same share as in the second quarter of 2025.
- In the second quarter of 2026, the share of federally insured credit unions with positive year-to-date net income was highest in Alaska, Maine, and Nevada (all 100%), followed by Hawaii and Michigan (both 98%).
- The share was lowest in Delaware (67%) and Arkansas (76%) in the second quarter of 2026.