ALEXANDRIA, Va. –For federally insured credit unions, assets, and shares and deposits increased at the median over the year ending in the second quarter of 2025, while loans outstanding declined slightly, according to the latest NCUA’s Quarterly U.S. Map Review, which also shows how credit unions performed by state.
Credit union membership continued to grow in the aggregate over the year ending in the second quarter of 2025. At the median, membership declined by 0.5%. Credit unions with falling membership tend to be small; over half had less than $50 million in assets in the second quarter of 2025.
Here’s how credit unions performed, according to NCUA:
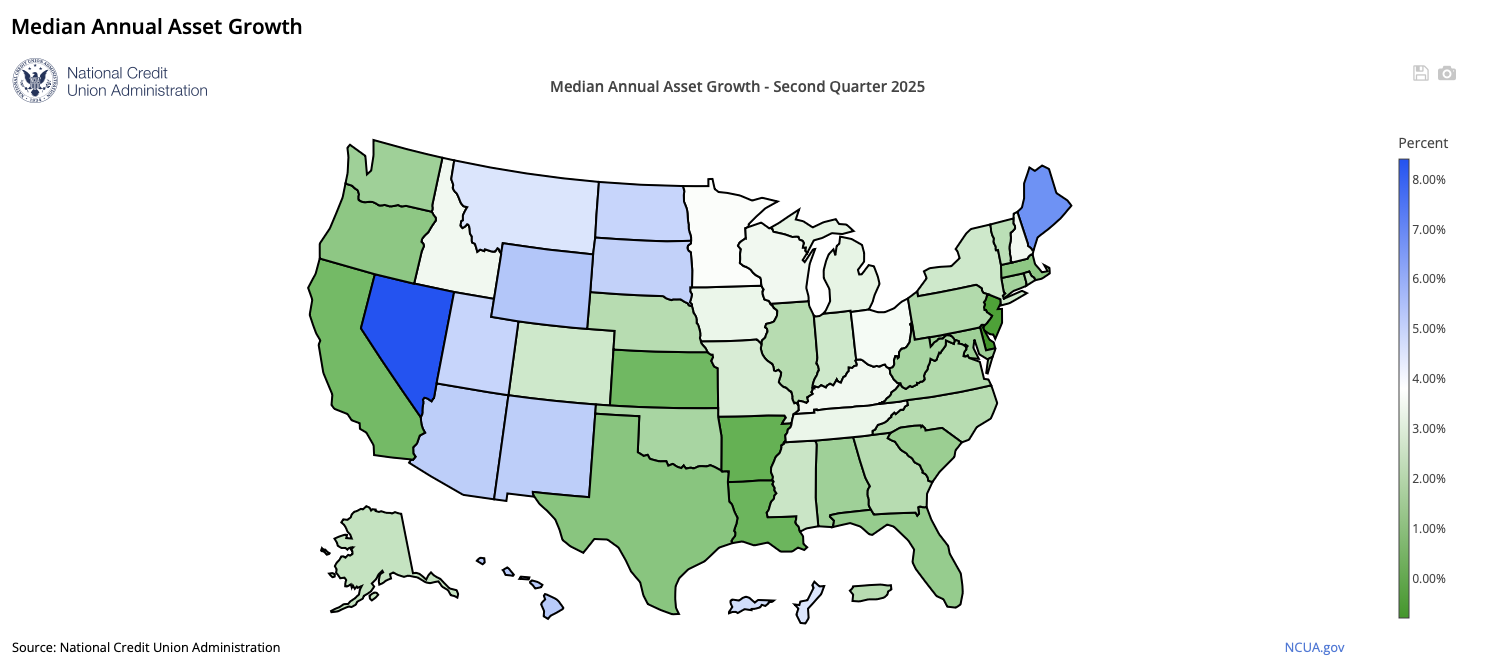
National Annual Asset Growth
- Nationally, assets in federally insured credit unions increased by 2.3% at the median over the year ending in the second quarter of 2025. In other words, half of all federally insured credit unions had asset growth at or above 2.3% and half had asset growth of 2.3% or less. During the year ending in the second quarter of 2024, the median growth rate in assets was negative 0.2%.
- Over the year ending in the second quarter of 2025, median asset growth was fastest in Nevada (8.4%) and Maine (6.7%).
- At the median, assets declined in Delaware (-0.8%) and New Jersey (-0.3%) over the year.
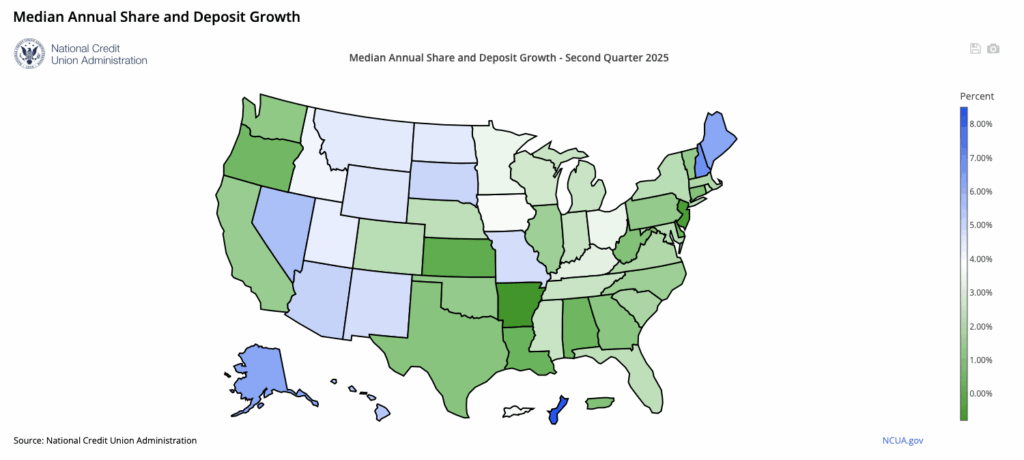
Median Annual Share & Deposit Growth
- Nationally, shares and deposits increased by 2.2% at the median over the year ending in the second quarter of 2025. During the year ending in the second quarter of 2024, the median growth rate in shares and deposits was negative 1.2%.
- Over the year ending in the second quarter of 2025, median growth in shares and deposits was fastest in New Hampshire (6.8%), followed by Alaska and Maine (both 6.2%).
- At the median, shares and deposits declined in Arkansas (-0.8%) and New Jersey (-0.4%) over the year.
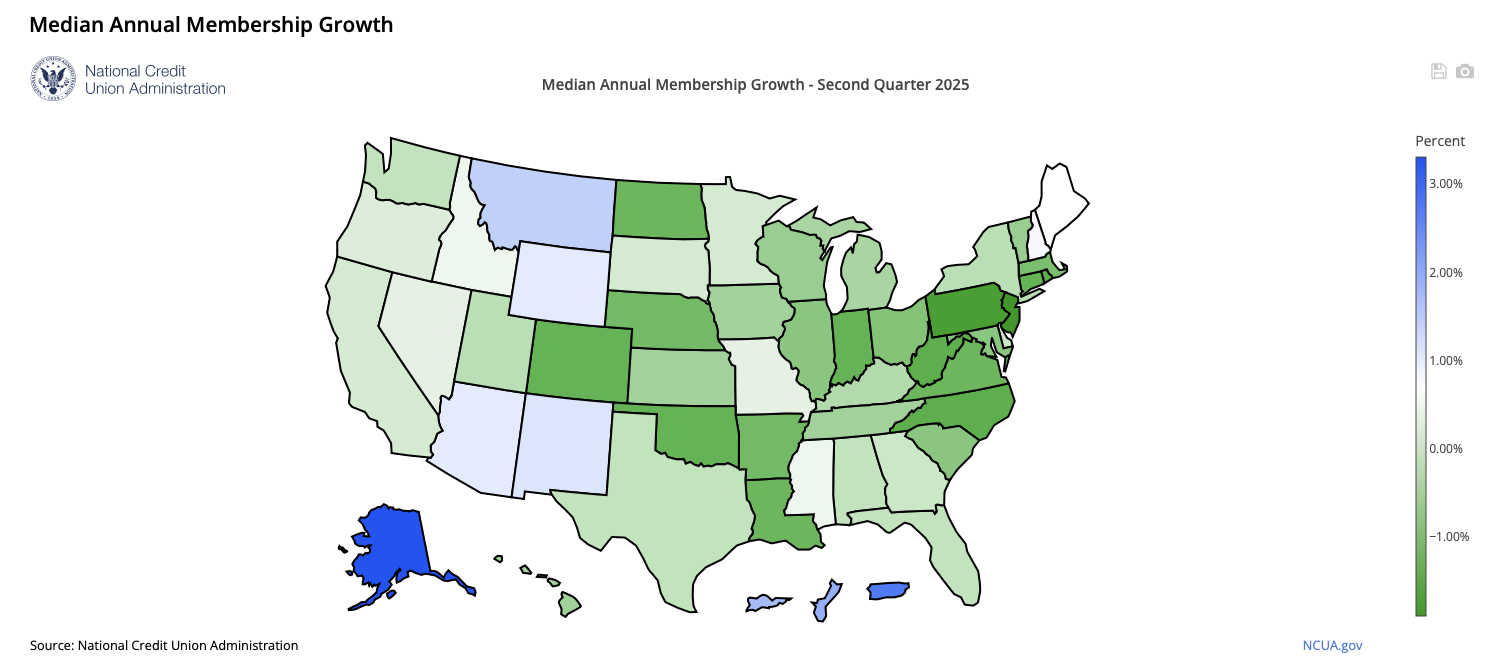
Median Annual Membership Growth
- While membership continued to grow in the aggregate over the year ending in the second quarter of 2025, at the median, membership declined by 0.5%. Membership declined by 0.3% at the median over the year ending in the second quarter of 2024. Overall, about 55% of federally insured credit unions had fewer members at the end of the second quarter of 2025 than a year earlier. Credit unions with falling membership tend to be small; over half had less than $50 million in assets in the second quarter of 2025.
- Over the year ending in the second quarter of 2025, credit unions headquartered in Alaska (3.3%) and Montana (1.4%) experienced the strongest median membership growth.
- At the median, membership declined in thirty states and Washington, D.C. over the year. New Jersey (-1.9%) and Pennsylvania (-1.7%) saw the largest median decline in membership.
Median Annual Loan Growth
- Nationally, loans outstanding declined by 0.2% at the median over the year ending in the second quarter of 2025. Over the previous year, loans increased by 2.4% at the median.
- Over the year ending in the second quarter of 2025, median loan growth was strongest in Nevada (6.6%) and Alaska (4.6%).
- At the median, loans outstanding declined in Washington, D.C. and twenty-five states over the year, led by West Virginia (-4.2%) and Arkansas (-3.0%).
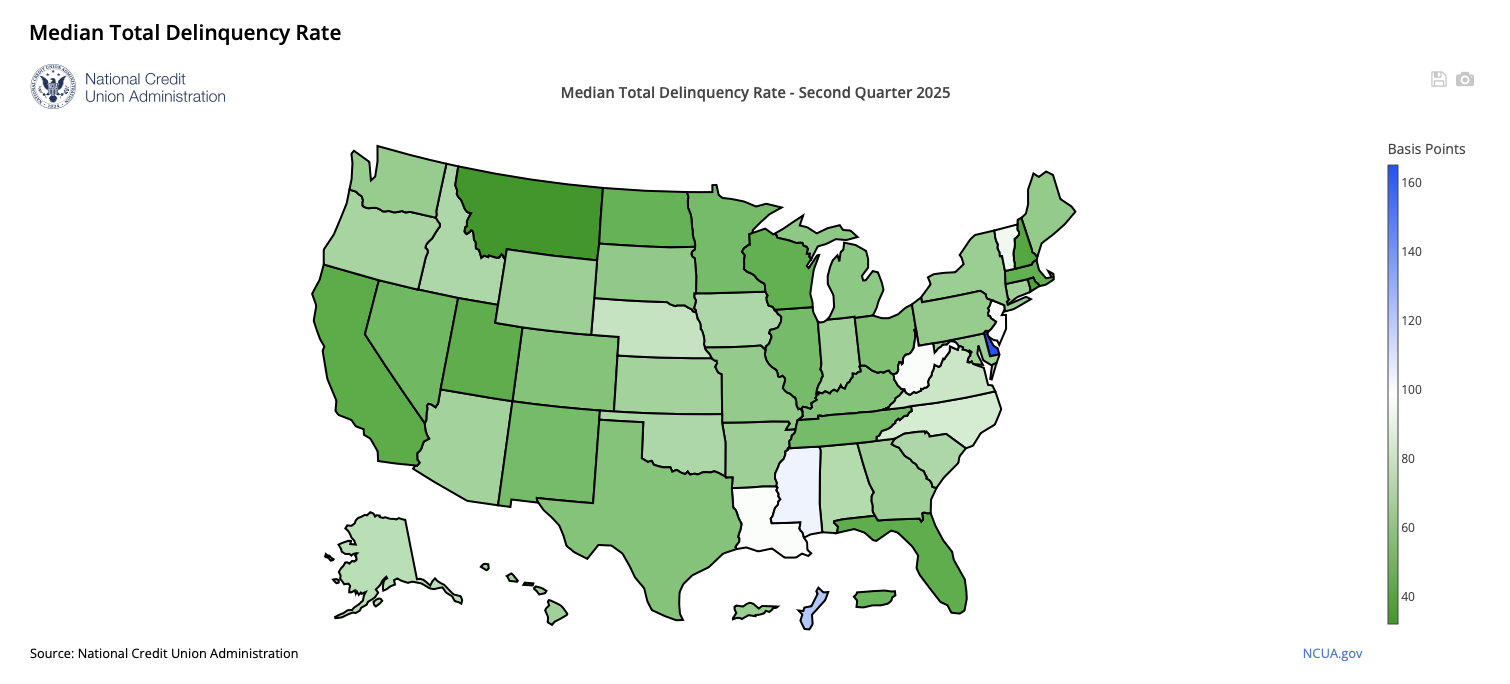
Median Total Delinquency Rate
- At the end of the second quarter of 2025, the median total delinquency rate among federally insured credit unions was 65 basis points, compared with 60 basis points at the end of the second quarter of 2024.
- At the end of the second quarter of 2025, the median delinquency rate was highest in Delaware (165 basis points) and Mississippi (103 basis points).
- The median delinquency rate was lowest in Montana (32 basis points) and Rhode Island (41 basis points) at that time.
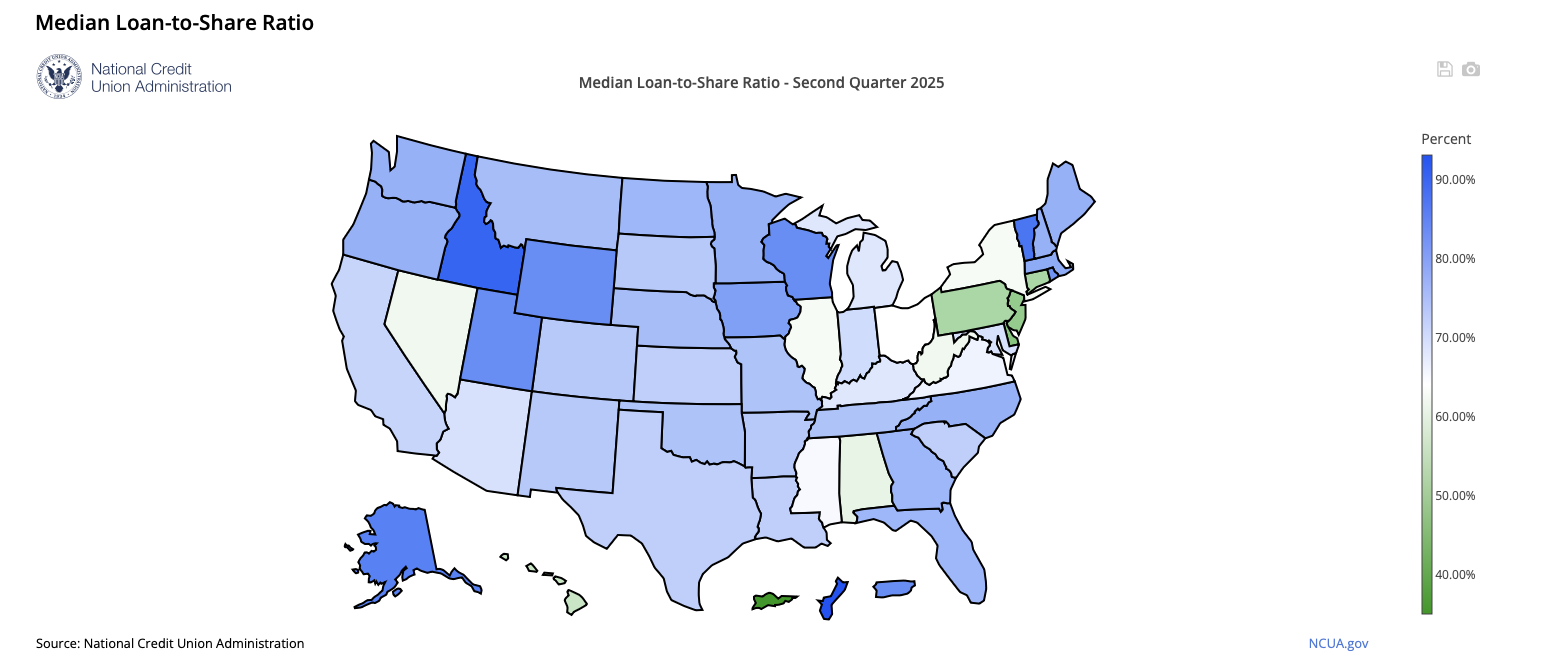
Median Loan-to-Share Ratio
- Nationally, the median ratio of total loans outstanding to total shares and deposits – the loan-to-share ratio – was 70% at the end of the second quarter of 2025. At the end of the second quarter of 2024, the median loan-to-share ratio was 71%.
- The median loan-to-share ratio was highest in Idaho (90%) and Vermont (87%) at the end of the second quarter of 2025.
- The median loan-to-share ratio was lowest in Delaware (48%) and New Jersey (50%) at that time.
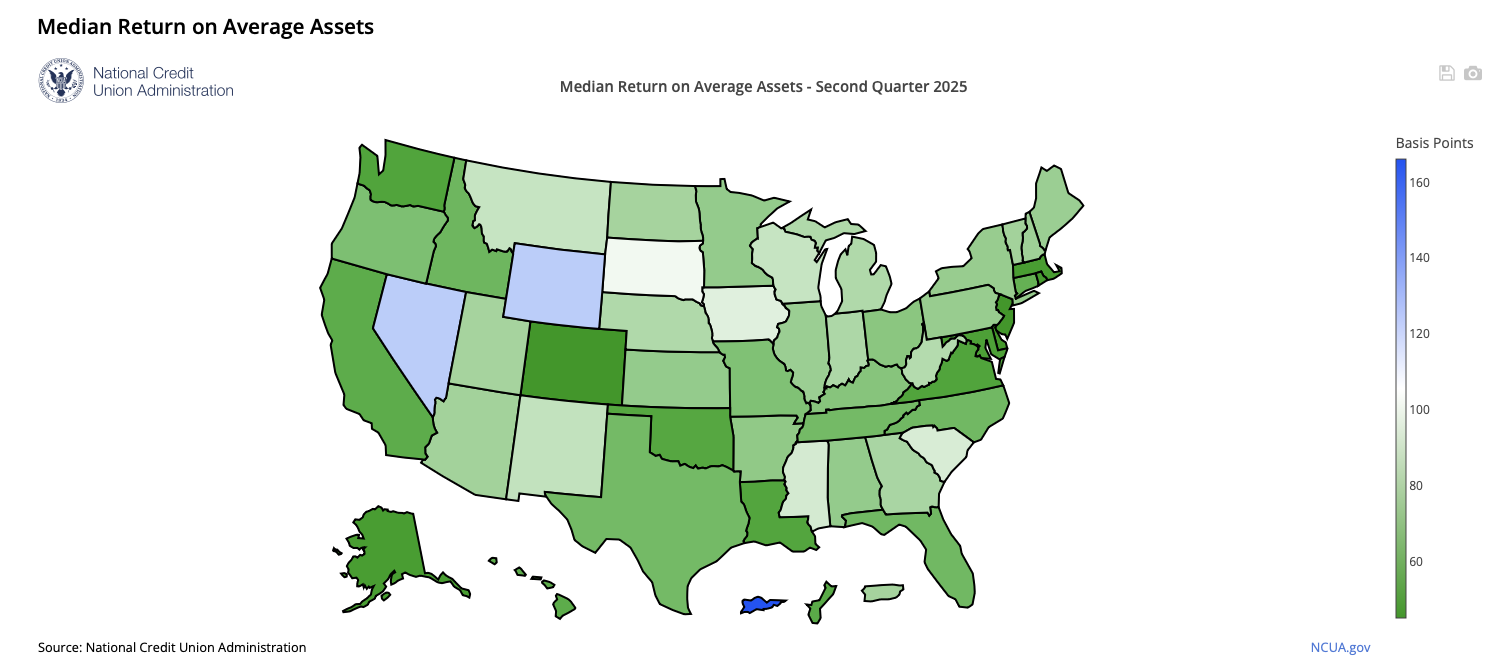
Median Return on Average Assets
- Nationally, the median annualized return on average assets at federally insured credit unions was 71 basis points in the first half of 2025, compared with 61 basis points in the first half of 2024.
- Nevada and Wyoming (both 123 basis points) had the highest median annualized return on average assets in the first half of 2025, followed by South Dakota (102 basis points).
- Colorado and New Jersey (both 45 basis points) had the lowest median annualized return on average assets at that time, followed by Delaware and Washington, D.C. (both 46 basis points).
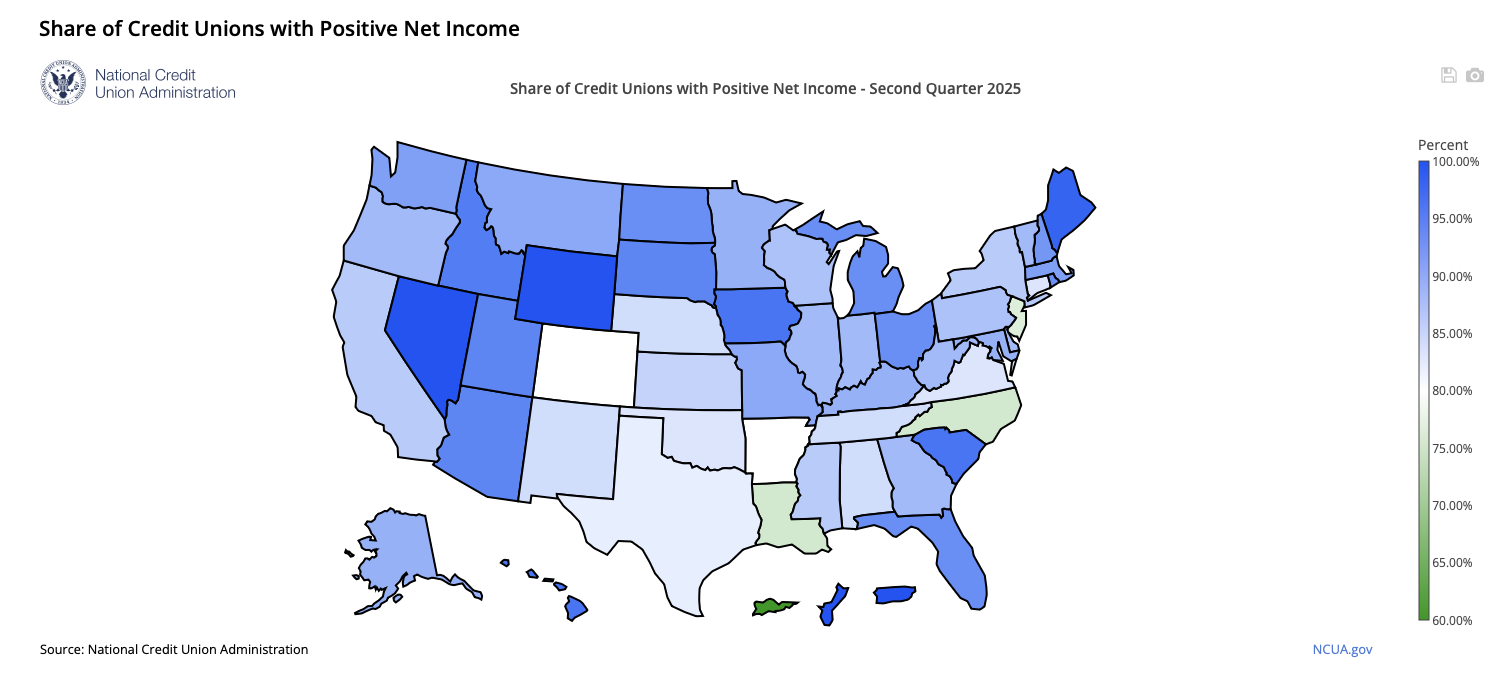
Share of Credit Unions with Positive Net Income
(Shares of credit unions with positive net income are rounded to the nearest percentage point.)
- Nationally, 87% of federally insured credit unions had positive year-to-date net income in the second quarter of 2025, compared with 84% in the second quarter of 2024.
- In the second quarter of 2025, the share of federally insured credit unions with positive year-to-date net income was highest in Nevada and Wyoming (both 100%), followed by Maine (98%).
- The share was lowest in Washington, D.C. (73%) at that time, followed by Louisiana and North Carolina (both 76%).