

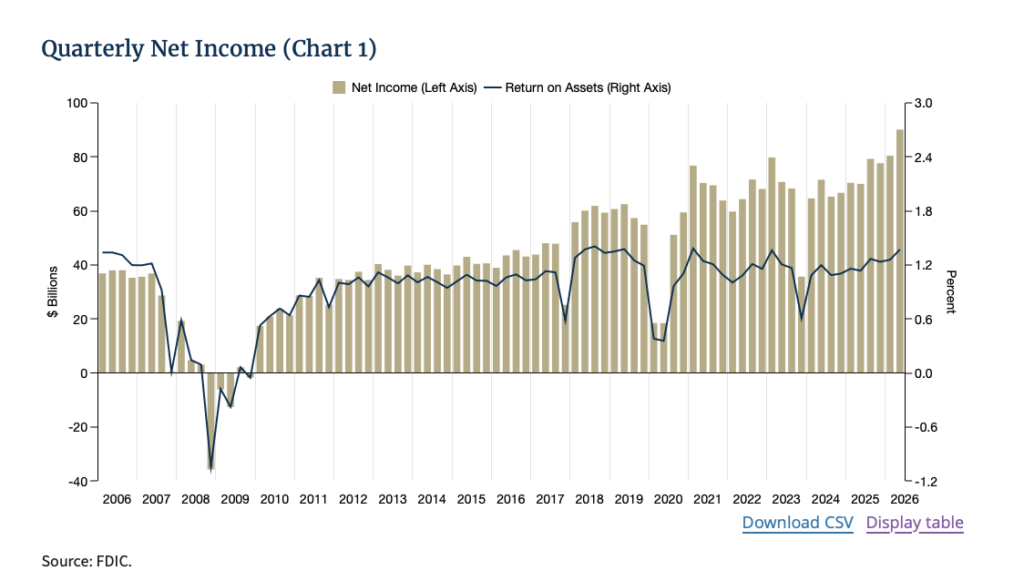
WASHINGTON — The nation’s banks reported $90.1 billion in net income during the second quarter, up 12% from the previous quarter and 28.7% from a year earlier, as revenue increased, provisions for credit losses declined and several measures of asset quality improved, according to the Federal Deposit Insurance Corp.
The FDIC’s Quarterly Banking Profile for the second quarter of 2026 also showed industry assets reaching $26.5 trillion, loans growing 6.8% from a year earlier and domestic deposits increasing for an eighth consecutive quarter.
At the same time, unrealized losses on securities edged higher from the first quarter and industry capital ratios declined as asset growth outpaced increases in capital.
Bank Earnings Rise to $90.1 Billion
Net income increased $9.7 billion, or 12%, from the first quarter to $90.1 billion. About 69% of FDIC-insured institutions reported higher quarterly earnings.
The FDIC said the quarterly increase was driven by:
- Noninterest income rising $5.5 billion, or 6.1%, primarily because of higher trading revenue and fee income.
- Securities gains increasing $5.5 billion, primarily because of one-time gains on equity securities transactions.
- Net interest income increasing $5.3 billion, or 2.8%.
- Provision expense declining $2.1 billion, or 10%.
- Noninterest expense increasing $4.4 billion, or 2.8%, partially offsetting those gains.
The industry’s return on assets increased to 1.37% from 1.26% in the first quarter and 1.14% a year earlier.
Compared with the second quarter of 2025, net income jumped $20.1 billion, or 28.7%. The FDIC said the increase reflected a combination of higher net interest and noninterest income, lower provisions and securities gains.
Provision expense declined sharply from a year earlier in part because the year-ago quarter included elevated provisions associated with a large-bank acquisition.
Net Interest Margin Edges Higher
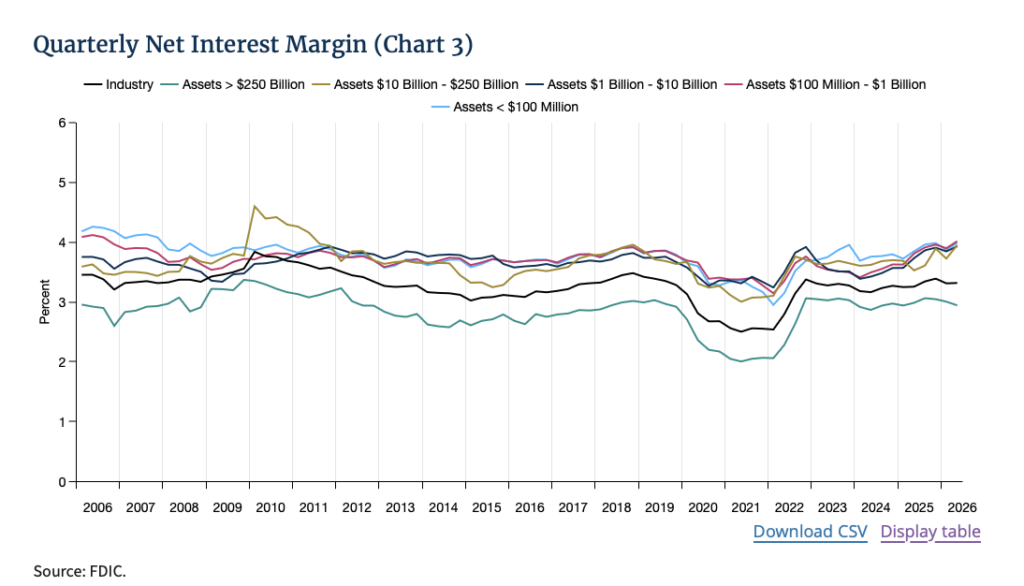
The industry’s net interest margin increased 1 basis point from the first quarter to 3.32%.
The yield on earning assets increased 2.3 basis points, slightly faster than the 1.6-basis-point increase in the cost of funds.
Operating Revenue Reaches $293.5 Billion
Net operating revenue, which includes net interest income and noninterest income, increased $10.8 billion, or 3.8%, from the first quarter to $293.5 billion.
Noninterest income increased $5.5 billion, or 6.1%, led by higher trading revenue, while net interest income rose $5.3 billion, or 2.8%, as growth in interest income exceeded growth in interest expense.
Expenses Increase 10% From a Year Earlier
Noninterest expense totaled $164.3 billion, up $4.4 billion, or 2.8%, from the first quarter and $15 billion, or 10%, from a year earlier.
The quarterly increase was driven primarily by a $5.4 billion, or 8.2%, increase in the FDIC’s “all other” noninterest expense category, which includes data processing, advertising and marketing, legal fees, and consulting and advisory expenses.
Salaries and employee benefits declined $1.2 billion, or 1.5%, from the first quarter but remained $4.8 billion, or 6.6%, higher than a year earlier.
Provisions Decline, Reserves Remain Stable
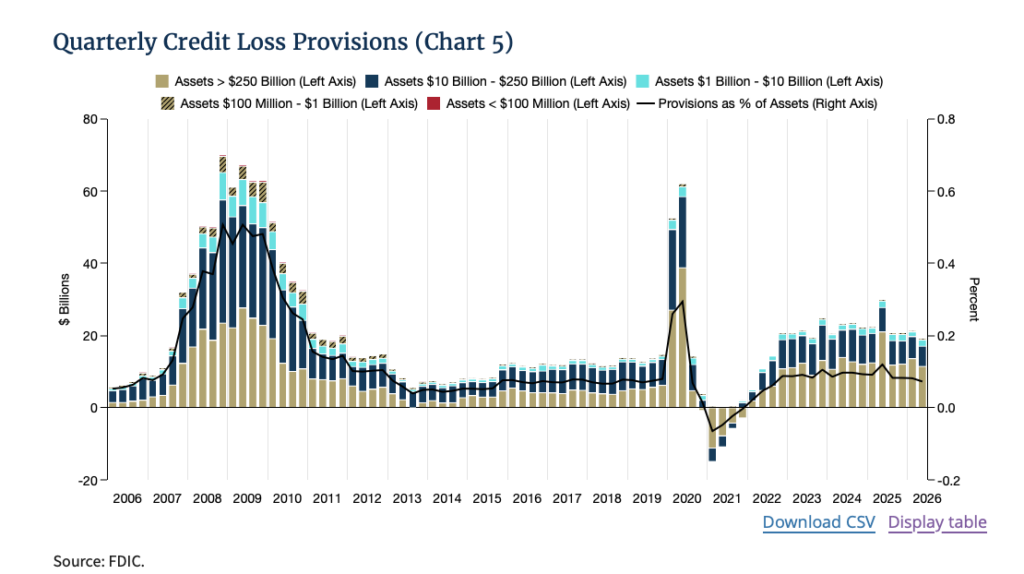
Provision expense totaled $19.3 billion, down $2.1 billion, or 10%, from the first quarter and $10.7 billion, or 35.8%, from a year earlier.
Provision expense was roughly equal to net charge-offs, while industry reserve balances remained largely unchanged at $223.9 billion.
The reserve coverage ratio — the allowance for credit losses as a share of noncurrent loans — increased to 172.7%. Noncurrent loan balances declined $4.7 billion, or 3.5%.
Asset Quality Improves
Loans that were at least 30 days past due or in nonaccrual status declined 9 basis points from the first quarter to 1.44%.
Among the largest improvements:
- Nonfarm nonresidential commercial real estate loans declined $2.4 billion, with the past-due and nonaccrual rate falling 14 basis points to 1.52%.
- Credit card balances in past-due or nonaccrual status declined $2.3 billion, with the rate dropping 27 basis points to 2.81%.
- Commercial and industrial loans declined $2.1 billion, with the rate falling 11 basis points to 1.27%.
- One- to four-family residential loans declined $1.6 billion, with the rate falling 8 basis points to 2%.
The industry’s net charge-off rate declined 2 basis points from the first quarter to 0.57% and was 3 basis points below its year-earlier level.
Unrealized Securities Losses Increase Slightly
Unrealized losses on securities totaled $326.7 billion, up $1.6 billion, or 0.5%, from the first quarter.
Losses, however, remained $68.6 billion, or 17.4%, below their level a year earlier and represented 5.5% of amortized cost.
Unrealized losses on available-for-sale securities totaled $109.8 billion, down $780 million from the first quarter and $33.9 billion from a year earlier.
Held-to-maturity securities had $216.9 billion in unrealized losses, up $2.4 billion, or 1.1%, during the quarter but down $34.7 billion, or 13.8%, from a year earlier.
Bank Assets Reach $26.5 Trillion
Total banking industry assets increased $316.8 billion, or 1.2%, during the quarter to $26.5 trillion. Assets were $1.5 trillion, or 5.9%, higher than a year earlier.
Quarterly growth included:
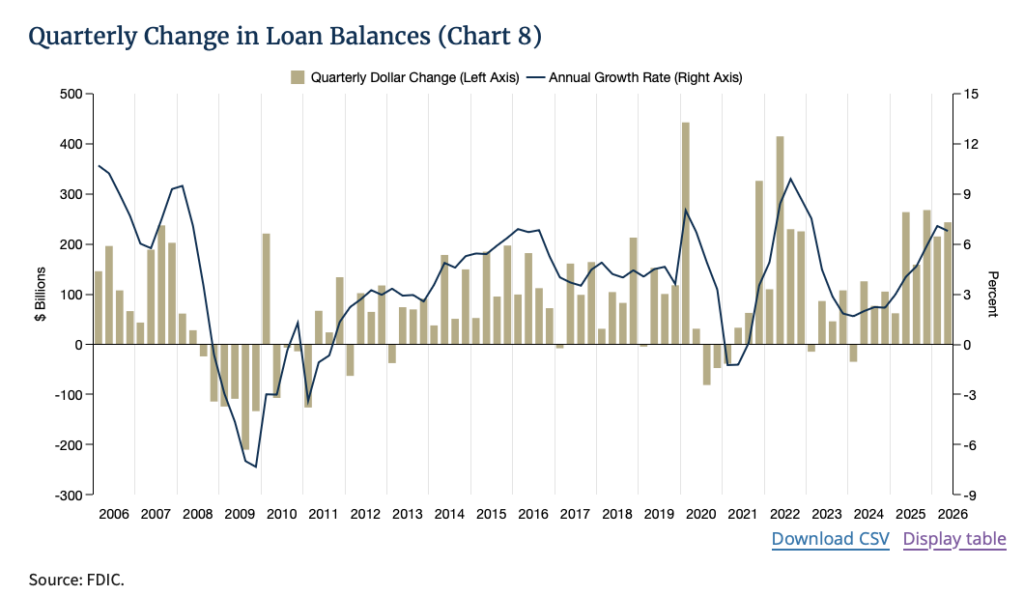
- Total loans increasing $243.5 billion, or 1.8%.
- Trading account assets rising $43 billion, or 3.2%.
- Federal funds sold and reverse repurchase agreements increasing $20.1 billion, or 2.5%.
- Securities increasing $19.4 billion, or 0.3%.
- Loan Growth Accelerates to 6.8%
Total loan and lease balances increased $243.5 billion, or 1.8%, during the quarter to $13.9 trillion.
The largest quarterly increases included:
- Loans to nondepository financial institutions, up $49.8 billion, or 3.4%.
- Commercial and industrial loans, up $46.6 billion, or 1.9%.
- Loans to purchase or carry securities, including margin loans, up $31.2 billion, or 5.8%.
- Credit card loans, up $28.3 billion, or 2.4%.
Total loans and leases were 6.8% higher than a year earlier.
Loans to nondepository financial institutions led annual growth, increasing $279.1 billion, or 22.4%. Loans to purchase or carry securities increased $131.3 billion, or 29.7%.
Deposits Increase for Eighth Straight Quarter
Domestic deposits increased $142.7 billion, or 0.8%, marking the eighth consecutive quarter of growth.
Estimated uninsured domestic deposits increased $317.4 billion, or 3.8%, and were the primary driver of overall deposit growth. Both interest-bearing and noninterest-bearing deposits increased during the quarter.
Capital Ratios Decline
Bank capital ratios declined during the second quarter as asset growth outpaced capital growth.
The Tier 1 risk-based capital ratio declined 17 basis points to 13.75%, while the leverage capital ratio also fell 17 basis points, to 8.98%.
Problem Bank List Shrinks
The number of institutions on the FDIC’s “Problem Bank List” declined by a net seven during the quarter to 47.
Problem banks represented 1.1% of all banks, which the FDIC said remains within the normal range of 1% to 2% during noncrisis periods.
Industry Consolidation Continues
The number of FDIC-insured institutions declined by 41 during the second quarter to 4,238.
During the quarter:
- Four banks opened.
- Four banks were sold to non-FDIC-insured institutions.
- 36 institutions merged with other banks.
- One bank failed.