
ALEXANDRIA, Va. — Federally insured credit unions reported stronger earnings, continued growth in assets and loans, and higher capital levels during the first quarter of 2026, according to data released by NCUA.
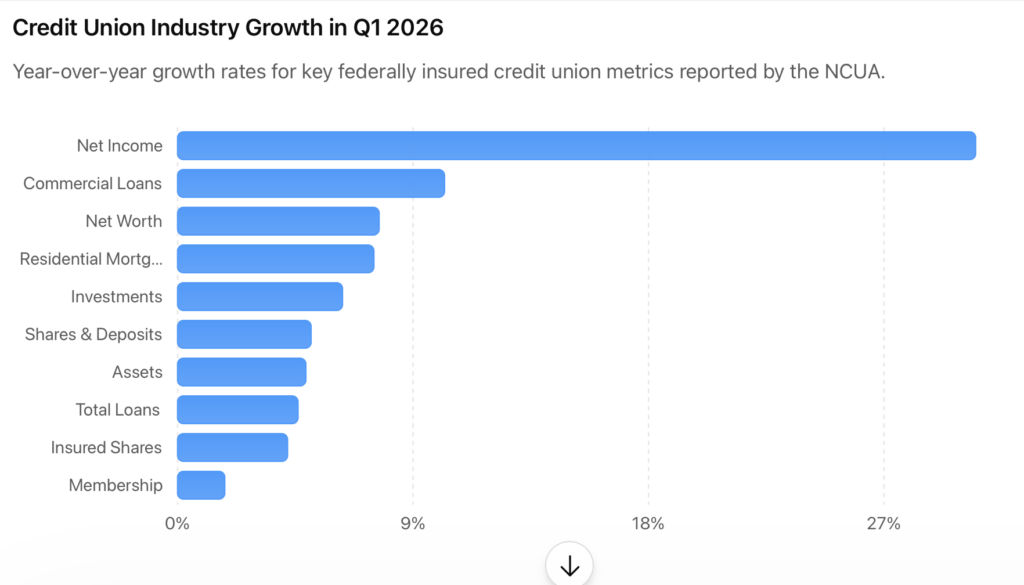
The agency reported that total assets at federally insured credit unions rose by $116.7 billion, or 4.9%, from a year earlier to $2.48 trillion as of March 31. Total loans outstanding increased by $75.8 billion, or 4.6%, to $1.73 trillion, while insured shares and deposits grew by $76 billion, or 4.2%, to $1.91 trillion.
The agency said federally insured credit unions served 145.8 million members at the end of the first quarter, an increase of 2.5 million members over the previous 12 months.

Net income reached an annualized $20.4 billion during the first quarter, up $4.8 billion, or 30.5%, from the same period in 2025.
The Data
The NCUA data also show:
- The credit union system’s net worth ratio increased to 11.24% from 10.95% one year earlier. The return on average assets improved to 0.83% from 0.67% a year earlier.
- The number of federally insured credit unions declined to 4,250 from 4,411 a year earlier, continuing a long-term consolidation trend. Of those institutions, 2,672 were federal credit unions and 1,578 were federally insured state-chartered credit unions.
- The number of low-income designated credit unions declined to 2,379 from 2,423 one year earlier, although those institutions accounted for 56% of all federally insured credit unions.
- The number of complex credit unions — those with assets greater than $500 million — increased to 748 from 740 a year earlier. Among those institutions, 464 operated under the Complex Credit Union Leverage Ratio framework with an average CCULR ratio of 12%, while 284 reported under the Risk-Based Capital framework with an average RBC ratio of 15.45%.
Assets, Investments and Loans
According to NCUA
- Total assets climbed to $2.48 trillion from $2.37 trillion one year earlier.
- Cash increased by $3.2 billion, or 1.5%, to $219.1 billion.
- Total investments rose by $24.7 billion, or 6.3%, to $415.8 billion.
Investment Balances
The NCUA reported the following investment balances by maturity:
- Investments maturing in one year or less increased by $3.5 billion, or 3.5%, to $104.6 billion.
- Investments with maturities between one and three years increased by $100 million, or 0.1%, to $105.8 billion.
- Investments with maturities between three and five years increased by $15.8 billion, or 19.6%, to $96.3 billion.
- Investments with maturities between five and 10 years increased by $5.8 billion, or 6.8%, to $91.3 billion.
- Investments with maturities greater than 10 years declined by $500 million, or 3%, to $17.7 billion.
Lending
Accpording to NCUA:
- Total loans outstanding increased to $1.73 trillion.
- The average outstanding loan balance rose to $19,557, an increase of $858, or 4.6%, from one year earlier.
- Loans secured by one- to four-family residential properties increased by $57.1 billion, or 7.5%, to $814 billion.
- First-lien residential mortgage balances increased by $34.3 billion, or 5.7%, to $632.2 billion.
- Junior-lien mortgage balances increased by $22.9 billion, or 14.4%, to $181.7 billion
- Commercial loans increased by $18.2 billion, or 10.2%, to $196.3 billion
- Credit card balances increased by $2.2 billion, or 2.6%, to $86 billion.
- Auto loan balances declined by $300 million, or 0.1%, to $479.6 billion.
- New auto loans declined by $3.6 billion, or 2.2%, to $158.3 billion.
- Used auto loans increased by $3.3 billion, or 1%, to $321.3 billion.
- Non-federally guaranteed student loans declined by $500 million, or 7.2%, to $6.4 billion.
NCUA also reported annualized lending activity of $599.5 billion during the first quarter, up 12.6% from one year earlier.
Mortgage Lending
- Real estate lending excluding commercial loans reached an annualized $212.8 billion, up 30.5% from the first quarter of 2025.
- Fixed-rate first-mortgage originations excluding commercial loans totaled an annualized $106 billion, up 53.4%.
- Commercial loan originations totaled an annualized $47.5 billion, up 15.4%.
- Federal credit unions originated an annualized $332.6 million in Payday Alternative Loans, up 13.4% from one year earlier.
Credit Quality
The NCUA reported the overall delinquency rate increased to 0.85% from 0.80% one year earlier.
The agency also reported:
- Delinquent loans totaled $14.6 billion at the end of the quarternon-commercial real estate delinquency rate rose to 0.63% from 0.54%.
- The non-commercial first-mortgage delinquency rate increased to 0.58% from 0.50%.
- The auto loan delinquency rate remained unchanged at 0.80%.
- The credit card delinquency rate increased to 2.04% from 2.02%.
- The non-commercial loan delinquency rate increased to 0.82% from 0.78%.
- The commercial loan delinquency rate increased to 1.01% from 0.93%.
- The net charge-off ratio improved slightly, declining to 0.81% from 0.83% one year earlier.
- Net charge-offs totaled $13.9 billion on an annualized basis, an increase of $360 million, or 2.6%, over the previous year.
Deposits and Capital
On the other side of the balance sheet:
- Total shares and deposits increased by $102.3 billion, or 5.1%, to $2.12 trillion.
- Regular shares increased by $14.6 billion, or 2.5%, to $590.4 billion.
- Other deposit accounts increased by $67.8 billion, or 6.5%, to $1.11 trillion.
The growth in other deposits was driven primarily by:
- A $35.7 billion increase, or 6.3%, in share certificate accounts.
- A $30.5 billion increase, or 8.7%, in money market accounts.
- The total number of deposit accounts reached 294.7 million, an increase of 7.1 million accounts, or 2.5%.
- Average deposit balances increased to $14,563 from $14,106 one year earlier, an increase of $457, or 3.2%.
- Insured shares and deposits totaled $1.91 trillion.
- The loan-to-share ratio declined to 81.47% from 81.85% one year earlier.
- The credit union system’s net worth increased by $19.9 billion, or 7.7%, to $279.2 billion.
- The prompt corrective action net worth ratio stood at 11.29%.
Income and Expenses
The NCUA reported annualized gross income of $152 billion during the first quarter, an increase of 6.2% from a year earlier.
The Q1 data also show:
- Total interest income increased by $8 billion, or 6.7%, to $126.4 billion.
- Gross interest income of $105.5 billion.
- Investment income of $20.9 billion.
- Non-interest income increased by $900 million, or 3.7%, to $25.5 billion.
Components of non-interest income included:
- Fee income of $10 billion.
- Other income of $14.5 billion
- Gains, losses and other non-interest income totaling $1 billion.
Expenses
- Total expenses, including provision expense, increased by $4.1 billion, or 3.2%, to $131.5 billion.
- Non-interest expenses increased by $5.5 billion, or 7.6%, to $76.9 billion.
- Employee compensation and benefits of $40.7 billion, up $3 billion, or 7.8%.
- Office expenses of $18.2 billion, up $1 billion, or 5.8%.
- Loan servicing expenses of $4.9 billion, up $350 million, or 7.8%.
- Other non-interest expenses of $13.1 billion, up $1.2 billion, or 9.7%.
Interest expense declined by $1.1 billion, or 2.5%, to $41.8 billion. That included:
- Interest on borrowed money of $4 billion, down 14.4%.
- Share dividends of $32.4 billion, down 1.5%.
- Interest on deposits of $5.4 billion, up 2.2%.
- Provision expense for loan and lease losses, or credit loss expense, declined by $300 million, or 2.4%, to $12.8 billion.
- The aggregate net interest margin widened by $9 billion, or 11.9%, to $84.7 billion.
- Net interest margin as a percentage of average assets increased to 3.44% from 3.24% a year earlier.
- Average assets totaled $2.46 trillion, up $121.2 billion, or 5.2%, from one year earlier.
Other Performance Measures
- The median credit union average cost of funds was 1.05%, compared with 1.06% a year earlier.
- The median average yield on loans increased to 6.22% from 6.04%.
- The median net interest margin rose to 3.69% from 3.57%.
- The median return on average assets increased to 0.66% from 0.62%.
Asset Distribution
The NCUA’s asset distribution data showed continued growth among institutions of all sizes. Twenty-five percent of federally insured credit unions had less than $16.4 million in assets, 50% had less than $66.1 million, 75% had less than $275 million, and 90% had less than $1.12 billion in assets.