ALEXANDRIA, Va.–Credit unions with higher combined OD and NSF fees per member do not seem to have lower fees per member for other services, and there is “no obvious evidence” of better interest rates “offsetting” higher OD and NSF fees, according to a new Research Note from NCUA.
Indeed, the agency said, its analysis found that estimating a simple linear model to the data reveals somewhat positive correlation: higher OD and NSF fees were associated with higher fees for other services.
The Research Note follows the collection of data beginning in Q1 2024 from credit unions of more than $1 billion in assets on their year-to-date revenues from non-sufficient funds (NSF) and overdraft (OD) fees, as provided via the 5300s.
Two Categories
The agency said its newest Research Note analyzes statistics for OD and NSF fees, with a particular focus on evaluating OD and NSF revenues as a fraction of total revenues. NCUA said that in using revenues for the first three quarters of 2024, it put credit unions into categories based on the share of their revenue derived from these two sources.
“While other ratios could be used, this ratio measures the relative importance of such fees to the credit union’s overall revenue generation,” NCUA said, adding that supervisory-related inferences should not be made from the observations in the Research Note, as “higher” and “lower” levels of OD and NSF fee income are simply meant to express relative levels.
“As outlined in a recent Letter to Credit Unions, while certain types of practices and product features may raise supervisory concerns, in general OD and NSF fees do serve legitimate business purposes,” NCUA said. “Given varying business models and diverse consumer preferences and, in some instances, needs, it is reasonable to expect that some credit unions will charge such fees and that the reliance on such fees will vary.”
The Specifics
Specifically, NCUA said its newest Research Note provides two particular observations on the relationship between OD and NSF fees and other revenues. The first looks at the relationship between OD and NSF fees and other types of fees collected by the credit union. The second evaluates the relationship between such fees and interest rates, as it analyzes net interest margins and interest rates on mortgages, NCUA said.
Summary Statistics
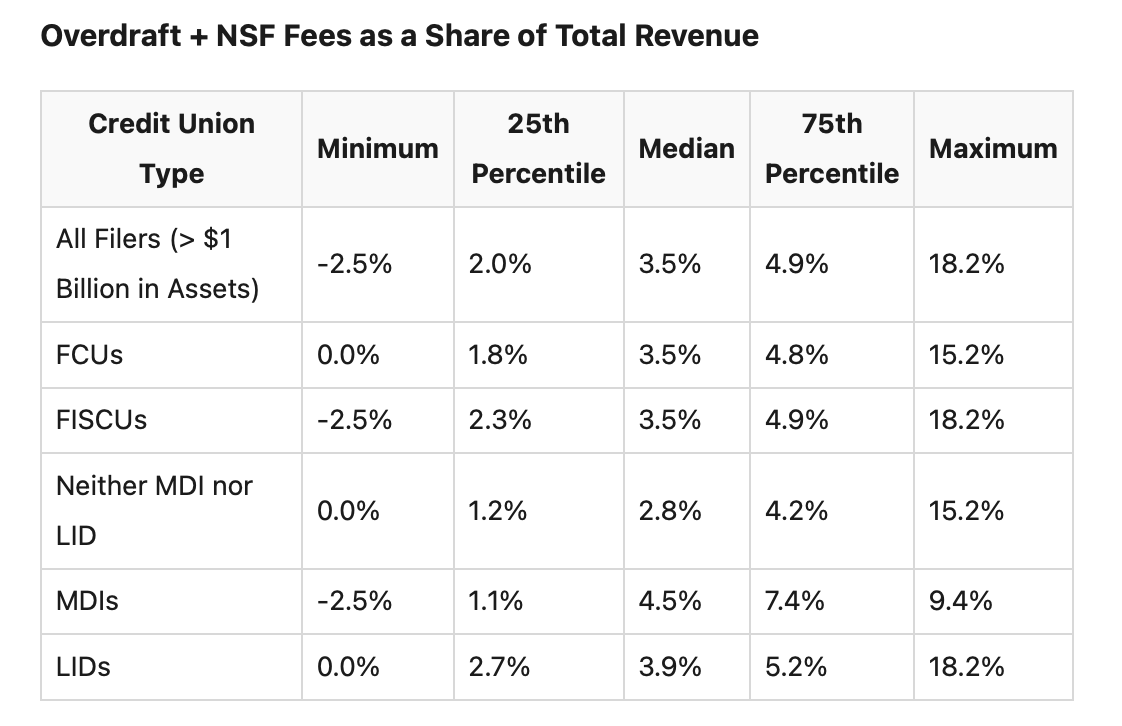
According to the agency, the 444 credit unions that supplied OD and NSF fee data to NCUA in Q3 of 2024 were used to create summary statistics for the share of revenues accounted for by these fees.
“In general, the table indicates that such fees make up about 2% to 5% of total revenues for the majority of these credit unions, although some deviate significantly from this range,” NCUA said. “Federal credit unions (FCUs) and federally insured, state-chartered credit unions (FISCUs) are not significantly different in their reliance on such fees, with nearly identical medians and similar distributions. Credit unions that are Minority Depository Institutions (MDIs) and those with low-income designations (LIDs) tend to have slightly higher combined OD and NSF fee revenues as a share of total revenue relative to those without those designations.”
NCUA stated that the statistics shown in the charts here do not control for other factors.
“A more in-depth analysis would be necessary to assess whether the relationships still hold after accounting for other factors (such as, credit union size, location),” NCUA said. “It is also important to recall that the collection of the OD and NSF data is recent, and more quarters of data are needed to fully understand the reliability of the reported information.”

Some OD/NSF Income ‘Observations’
The NCUA Research Note did offer a number of observations, including:
Observation 1: Credit unions with higher combined OD and NSF fees per member do not seem to have lower fees per member for other services.
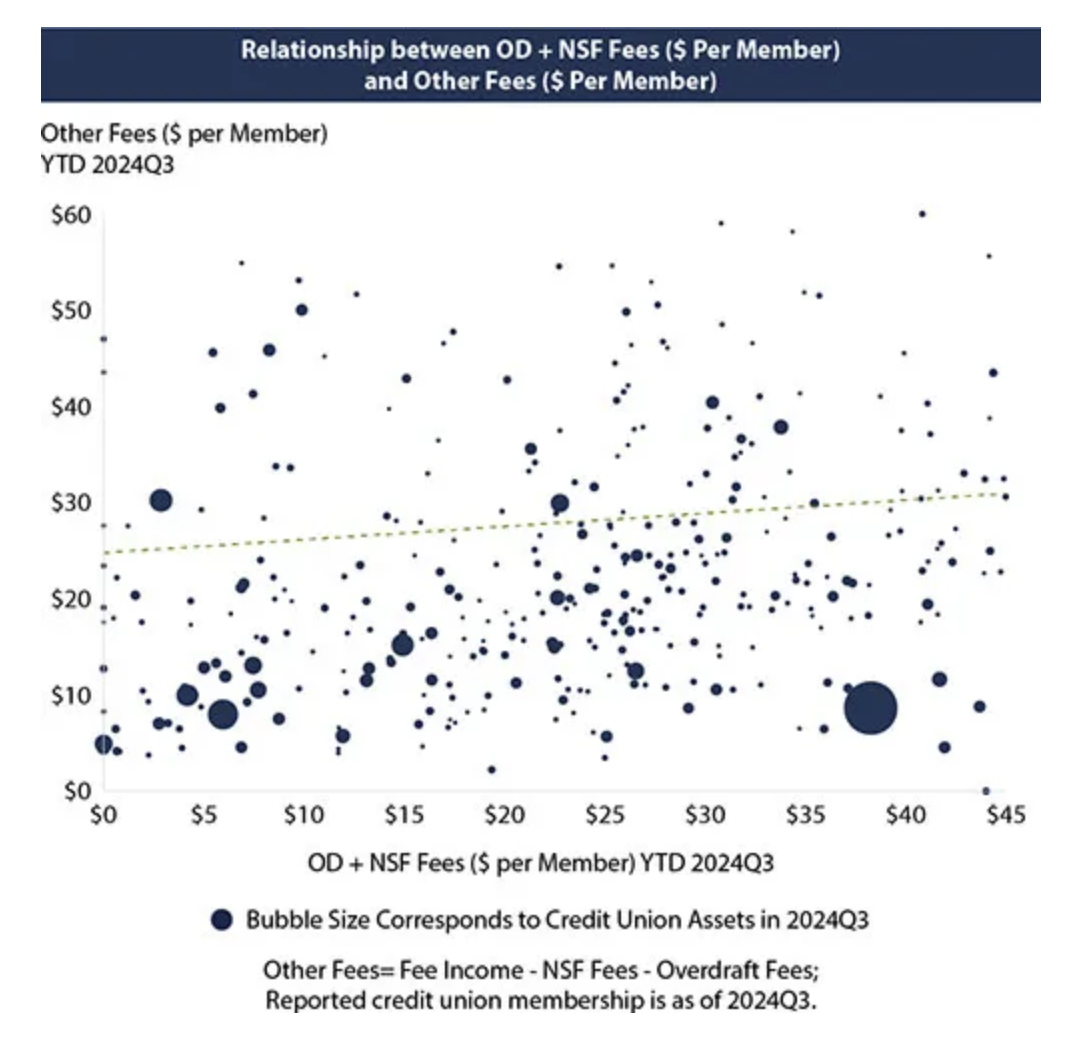
“As credit unions have numerous pricing ‘levers’ to adjust to cover costs, some might ask whether credit unions with higher OD and NSF fees have correspondingly lower fees for other services,” NCUA stated. “The chart (shown in this report) graphically evaluates that hypothesis by comparing OD and NSF revenues to other fees. Specifically, for the first three quarters of 2024, the scatter plot compares combined OD and NSF fees per member against other fees collected per member. The relative size of the dots is proportionate to the credit union assets as of 2024Q3.
“The graph indicates that, at least in the first three quarters of 2024, there was little evidence of such an inverse relationship between the two types of fees,” the agency analysis continued. “Indeed, estimating a simple linear model to the data (reflected as the dotted line in the graph), one finds a somewhat positive correlation: higher OD and NSF fees were associated with higher fees for other services.”
Observation 2: Credit unions with higher combined OD and NSF fee revenues do not seem to be using those fees to “subsidize” better interest rates.
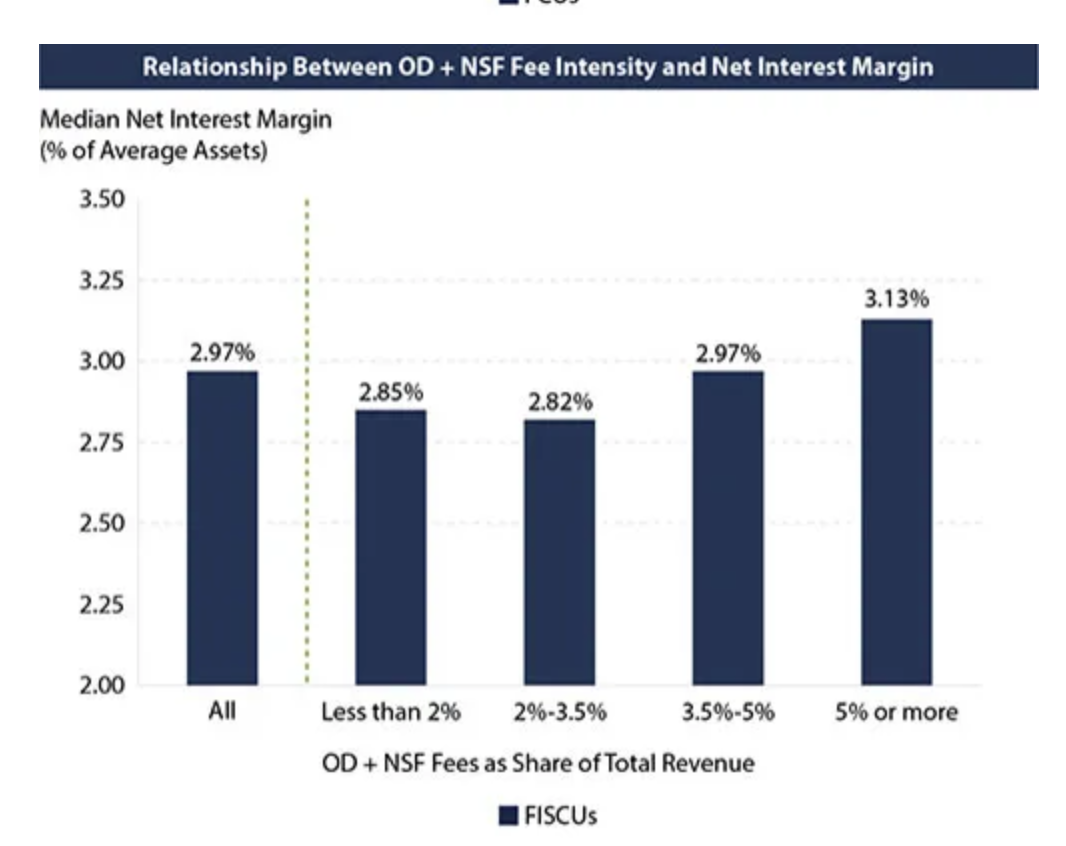
“One might also ask whether credit unions with higher OD and NSF fees use those fees to facilitate offering more attractive interest rates,” the agency analysis suggested. “The graphs (shown in this story) suggest that may not be the case.
“Comparing OD and NSF fees to net interest margins for FCUs and FISCUs separately, the graphs indicate that higher combined OD and NSF fees are associated with higher net interest margins (NIMs),” NCUA said. “The relationship was much more pronounced for FCUs, where median NIMs increased 72 basis points from 2.59% for the credit unions with the lowest OD and NSF fees to 3.31% for those with the highest OD and NSF fees. For FISCUs, the range was 28 basis points (from 2.85% to 3.13%).”
NCUA added that analyzing net interest margins provides a “high-level perspective on credit union pricing, but the relationship shown could simply be the result of differences in the overall credit risk of membership; higher average margins could merely reflect higher average credit risk.
“To pursue a more informative measure of the relationship between interest rates and OD and NSF fees, one might want to look at risk-adjusted interest margins,” the analysis continued. “Such a comparison might be useful for assessing whether higher OD and NSF fees were subsidizing preferred pricing elsewhere (like, through lower loan rates).
What HMDA Data Show
While no comprehensive data are available for wholistic evaluation of risk-adjusted pricing, NCUA noted loan-level data submitted under the Home Mortgage Disclosure Act (HMDA) provide a readily available option for mortgages.
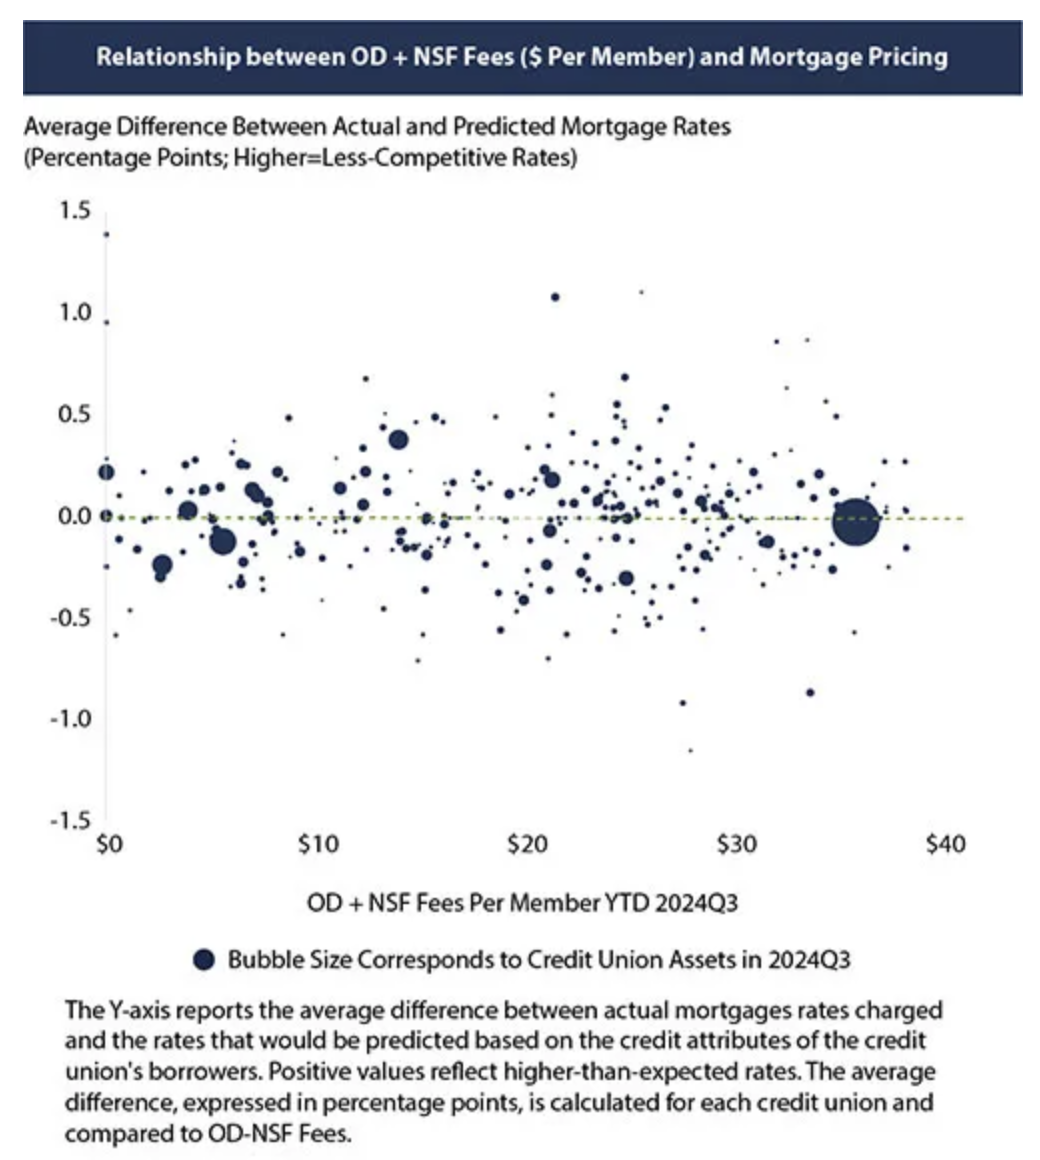
“Using detailed loan data from credit union HMDA filers for 2023, OCE has estimated the degree to which each credit union’s mortgage rates deviated from what would be expected given the institution’s loan characteristics,” NCUA said. “Those deviations might be correlated with risk-adjusted margins and thus can be compared to OD and NSF fees.”
The agency noted the chart shown in this story indicates that higher OD and NSF fee revenues were generally not associated with more favorable mortgage rates for members.
What the Scatterplot Reveals
“Specifically, the scatterplot suggests that credit unions with higher OD and NSF fees (measured on a dollar-per-member basis) generally did not evidence lower mortgage rates in 2023; generally, a fitted line shows no clear relationship between the two,” the NCUA Research Note states. “To be sure, this is a less-than-ideal analysis because it only looks at mortgages rates (instead of all interest rates) and only includes HMDA-filing credit unions. Also, the mortgage rates are from 2023, whereas the OD and NSF data are for 2024.
“Those imperfections aside, the qualitative result does not contrast sharply with what was shown in the NIM graphs: There is no obvious evidence of better interest rates “offsetting” higher OD and NSF fees,” the analysis adds.
The Conclusion
What is to be concluded from the analysis? According to NCUA, although the analyses in the Research Note provide some high-level information about how credit union OD and NSF fees differ for various types of credit unions, the data collection will be especially valuable in tracking such fees over time.
“With only three quarters of OD and NSF data currently available, evaluating meaningful time trends is not yet possible. OCE plans to analyze evolving trends in those revenues as more data become available,” NCUA said. “To the extent that those trends—or other cross-sectional analyses of such fees—reveal notable observations, those findings may be made available in future Research Notes.”