

By Steven J. Berkowitz

It seems to be accepted wisdom that economies of scale exist as credit unions grow. The data suggests that operating expense to average assets do decrease as assets expand, but does this translate into increases in return on average assets?
To investigate this, I compared return on average assets across six asset groups. The analysis uses December 2023, December 2024, December 2025, and June 2026 NCUA call report data. I excluded the Jackson Area FCU from the analysis because of the distortion created in 2026 by the high miscellaneous expense recorded as part of the credit union being placed into conservatorship.
Observations
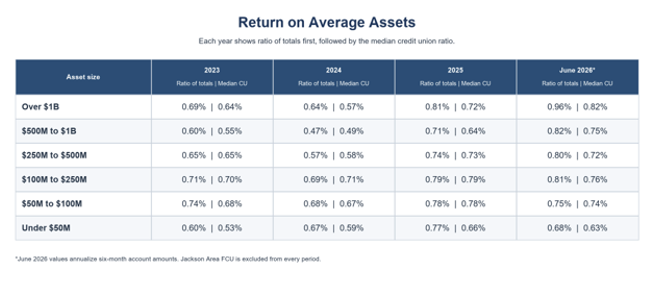
Return on average assets does not rise in a smooth pattern across every size group. This supports the notion that smaller credit unions may outperform larger credit unions in generating net income relative to their asset size.
The patterns do not prove that size alone cause differences. The groups also differ in business mix, products, geography, technology, and operating choices.
For each credit union, I matched prior period assets by charter number and calculated average assets as the average of its current and prior period total assets. The group total ratio divides the group’s total account amount by the sum of its credit unions’ average assets. The median is calculated from the individual credit union ratios, giving each credit union equal weight.
The analysis uses NCUA account 010 for total assets and 661A for net income or loss. June 2026 account amounts cover six months, so I doubled them to estimate a full year. These annualized figures are estimates, not full year results.
Twelve credit union records had no matching prior period asset record: three in 2023, six in 2024, and three in 2025. All were in the Under $50M group. For those records, I set prior period assets to zero.
The median results show that the difference does not depend only on a few very large credit unions.
ROAA Does Not Follow a Simple Size Pattern
Return on average assets varied across groups and periods. Smaller groups sometimes reported higher returns. The results do not show a steady increase in returns as asset size rises.
What Can We Conclude
Across four reporting periods, asset size alone does not correlate with return on average assets. Smaller asset size credit unions demonstrate that they can achieve higher returns on average assets than larger credit unions.
The analysis does not establish cause and effect. Credit unions differ in product mix, loans and investments, geography, technology, staffing, and services. Group membership also changes from period to period.
Steven J. Berkowitz is the current chairman of the board of the NIHFCU. He has previously served as Treasurer and Secretary, and he has chaired the Executive Committee, the Asset Liability Management Committee, and the Strategic Planning Committee. He has participated on numerous other committees over his 35 years as a board member. Mr. Berkowitz is a Certified Public Accountant and holds a Master in Business Administration degree from the University of Maryland. Mr. Berkowitz supported the NIH for over 41 years. He has received many NIH and IC Directors awards and awards of merit, including the Secretary of DHHS’ Distinguished Service award. In 2025, Mr. Berkowitz received the MD|DC Credit Union Association’s Volunteer of the Year Award.





One Response
Not only can small credit unions be very profitable, but they can provide unique value to their members and small communities, often in ways that large institutions can’t. We need both: big and small.
-Doug Wadsworth